Unlock a world of possibilities! Login now and discover the exclusive benefits awaiting you.
- Qlik Community
- :
- Forums
- :
- Analytics & AI
- :
- Products & Topics
- :
- Visualization and Usability
- :
- avg(aggr())
- Subscribe to RSS Feed
- Mark Topic as New
- Mark Topic as Read
- Float this Topic for Current User
- Bookmark
- Subscribe
- Mute
- Printer Friendly Page
- Mark as New
- Bookmark
- Subscribe
- Mute
- Subscribe to RSS Feed
- Permalink
- Report Inappropriate Content
avg(aggr())
Hi everybody, I need an help: I'm working on a qliksense document. I need to create a table with Cluster's Average range to today and to another day choose by user and then growth or decrease with green or red symbol. .
I can't use the right way to do this. I found a way to calculate Client's Average range
I attach the qliksense app and I hope Someone can help me,
Thank You Anna 
- Mark as New
- Bookmark
- Subscribe
- Mute
- Subscribe to RSS Feed
- Permalink
- Report Inappropriate Content
Hi Anna,
What's exactly the issue ?
I took a look at your document, I tried to put September 10 as date but I don't understand the chart object and column involved.
Follow me on my LinkedIn | Know Gamma Informatica at gammainformatica.it
- Mark as New
- Bookmark
- Subscribe
- Mute
- Subscribe to RSS Feed
- Permalink
- Report Inappropriate Content
Hi Andrea,
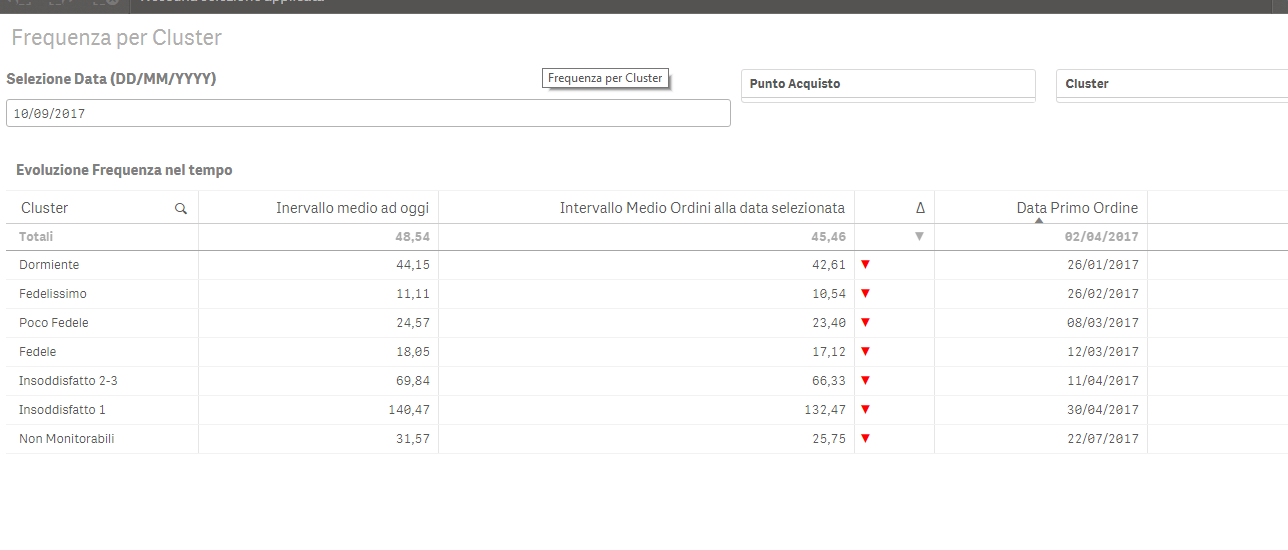
My problem is that i can't measure 'average interval' for all client's cluster because this measure is only for single client. i can't find a diffeent solution.You have to look the columns 'Average Interval at Today' and 'Average interval at selected date'. This is what you should see by entering September 10.
! !
- Mark as New
- Bookmark
- Subscribe
- Mute
- Subscribe to RSS Feed
- Permalink
- Report Inappropriate Content
what's the expected results for the two columns ?
and also how those columns should be calculated ?
Follow me on my LinkedIn | Know Gamma Informatica at gammainformatica.it
- Mark as New
- Bookmark
- Subscribe
- Mute
- Subscribe to RSS Feed
- Permalink
- Report Inappropriate Content
I want to calculate the average order interval for each cluster. The Middle Order Range at today column is fine because I did an average of the Interval Media field while I can not calculate the Middle Order Range at selected date column using the formula Data selezionata – data primo ordine /Numero Totale because for every cluster i have too many min(data ordine) . The expected results is like this but with only cluster dimension:
- Mark as New
- Bookmark
- Subscribe
- Mute
- Subscribe to RSS Feed
- Permalink
- Report Inappropriate Content
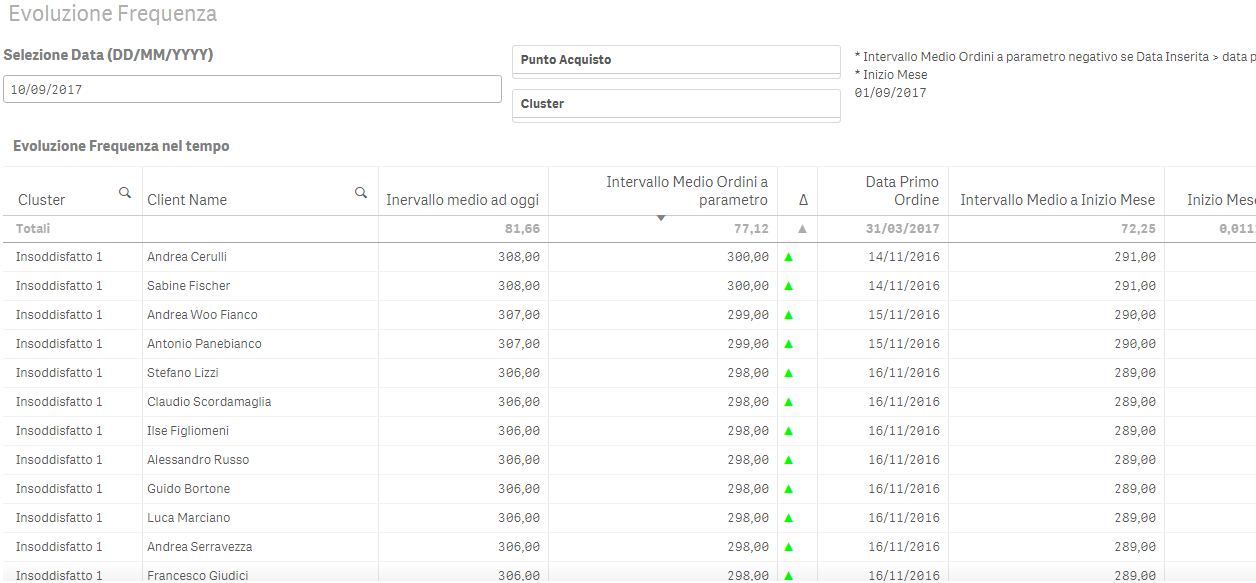
I have to exspand IntervalloMedioOrdiniCliente to the entire customer's cluster.
This is the part of script where i calculate the field:
NumeroOrdiniRif:
NoConcatenate
LOAD
[Client ID],
sum([Numero Ordini]) as [Numero Ordini per Cliente],
(Today()-min([Data Ordine])) as gg,
max([Data Ordine]) as maxData,
min([Data Ordine]) as minData,
(Today()-min([Data Ordine]))/sum([Numero Ordini]) as IntervalloMedioOrdiniCliente
Resident Ordine_T
where [Order State 2] = 'Confermato'
group by [Client ID];
- Mark as New
- Bookmark
- Subscribe
- Mute
- Subscribe to RSS Feed
- Permalink
- Report Inappropriate Content
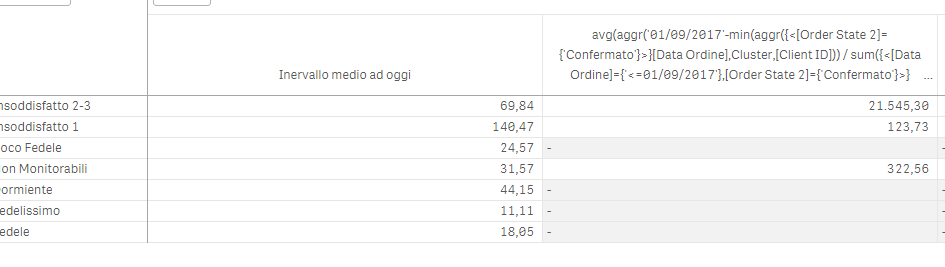
I need to calculate the avarege for field intervallo medio alla data selezionata:
I used this formula but it doesn't work:
avg(aggr(if(isnull(column(1))=0 and ('$(vMeasure2)'-min({<[Order State 2]={'Confermato'}>}[Data Ordine]))
/sum({<[Data Ordine]={'<=$(vMeasure2)'},[Order State 2]={'Confermato'}>}[Numero Ordini])>=0,
('$(vMeasure2)'-min({<[Order State 2]={'Confermato'}>}[Data Ordine]))
/sum({<[Data Ordine]={'<=$(vMeasure2)'},[Order State 2]={'Confermato'}>}[Numero Ordini]))),Cluster)
- Mark as New
- Bookmark
- Subscribe
- Mute
- Subscribe to RSS Feed
- Permalink
- Report Inappropriate Content
try using this expression in first table:
avg(
aggr(
avg( ( '$(vMeasure2)'-minData )
/
[Numero Ordini per Cliente] ), Cluster, [Client Name] )
)
and the below for the same measure in second table:
avg( ( '$(vMeasure2)'-minData )
/
[Numero Ordini per Cliente])
if you select a single cluster they should have the same value.
Follow me on my LinkedIn | Know Gamma Informatica at gammainformatica.it
- Mark as New
- Bookmark
- Subscribe
- Mute
- Subscribe to RSS Feed
- Permalink
- Report Inappropriate Content
Andrea sei italiano? Ho provato in questo modo ma non funziona:
avg(aggr('$(vMeasure2)'-min(aggr({<[Order State 2]={'Confermato'}>}[Data Ordine],Cluster,[Client ID]))
/
sum({<[Data Ordine]={'<=$(vMeasure2)'},[Order State 2]={'Confermato'}>}[Numero Ordini]),Cluster,[Client ID]))
- Mark as New
- Bookmark
- Subscribe
- Mute
- Subscribe to RSS Feed
- Permalink
- Report Inappropriate Content
sì ho dato un'occhiata ma ci vorrebbe ancora più tempo.
Follow me on my LinkedIn | Know Gamma Informatica at gammainformatica.it