Unlock a world of possibilities! Login now and discover the exclusive benefits awaiting you.
- Qlik Community
- :
- Forums
- :
- Analytics
- :
- New to Qlik Analytics
- :
- Re: Ignore Dimension-Filter for If Statement in Pi...
- Subscribe to RSS Feed
- Mark Topic as New
- Mark Topic as Read
- Float this Topic for Current User
- Bookmark
- Subscribe
- Mute
- Printer Friendly Page
- Mark as New
- Bookmark
- Subscribe
- Mute
- Subscribe to RSS Feed
- Permalink
- Report Inappropriate Content
Ignore Dimension-Filter for If Statement in Pivot Table
Hey there,
I have an really frustrating problem and hope you might be able to help me.
The following example does not make much sense, but is a downsized / abstract version of my problem.
Table:
load * inline
[Dimension1,Dimension2, Value
A,XX,1
B,YY,2
C,ZZ,3];
Now I create a new sheet with
- Pivot-Table
- Row: Dimension1
- Colum: Dimension2
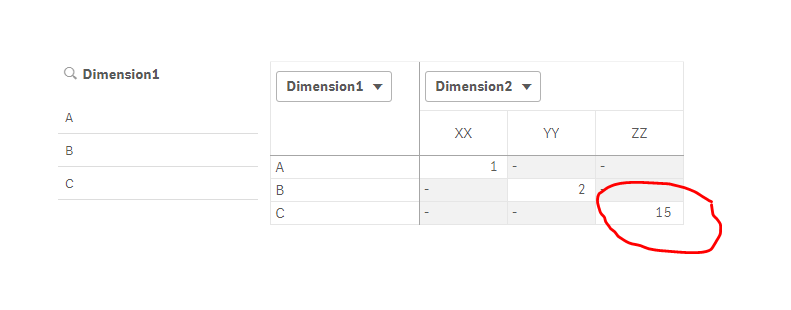
- Expression: if(Dimension2 = 'ZZ', 15, Sum({1}Value))
- Filter
- Dimension1
This works great if there is no filter set.
But is not working anymore as soon as i use a filter.
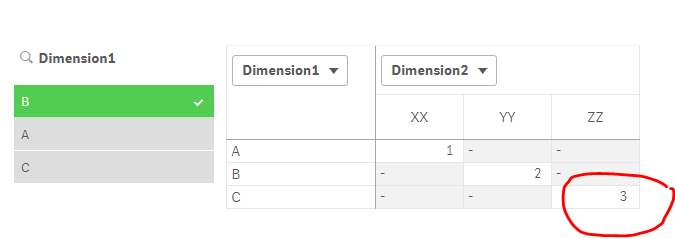
I want to have that table completely independent from any filters that are used.
Do you have any idea of how to achieve this?
Thanks very much for your help!
- Mark as New
- Bookmark
- Subscribe
- Mute
- Subscribe to RSS Feed
- Permalink
- Report Inappropriate Content
Before Reload:
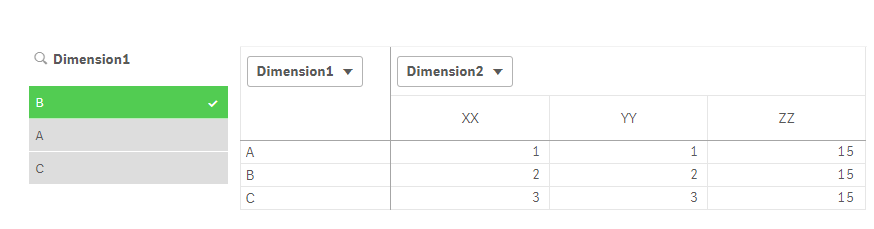
After Reload:
- Mark as New
- Bookmark
- Subscribe
- Mute
- Subscribe to RSS Feed
- Permalink
- Report Inappropriate Content
That is strange... I reloaded 3 times, saw the same result for ZZ... can you try to reload the attached qvf?
- Mark as New
- Bookmark
- Subscribe
- Mute
- Subscribe to RSS Feed
- Permalink
- Report Inappropriate Content
Hey,
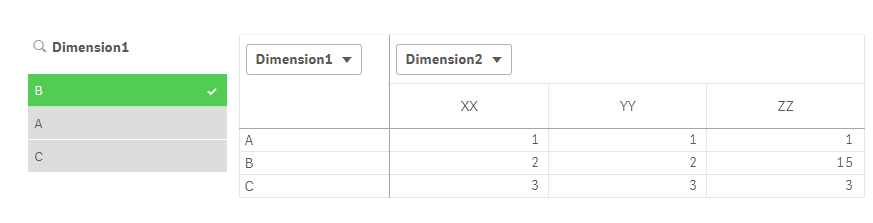
same behavior with your App. Changing the filter does not change the pivot table. Keeping the filter and doing a reload updates the table.
- Mark as New
- Bookmark
- Subscribe
- Mute
- Subscribe to RSS Feed
- Permalink
- Report Inappropriate Content
What version of Qlik Sense are you using?
- Mark as New
- Bookmark
- Subscribe
- Mute
- Subscribe to RSS Feed
- Permalink
- Report Inappropriate Content
what's your expected result for the bar chart?
- Mark as New
- Bookmark
- Subscribe
- Mute
- Subscribe to RSS Feed
- Permalink
- Report Inappropriate Content
I am using September 2017 - 11.14.3
- Mark as New
- Bookmark
- Subscribe
- Mute
- Subscribe to RSS Feed
- Permalink
- Report Inappropriate Content
Just downloaded September 2017 Patch 1 (11.14.4) and yet again not seeing the issue... anyways I am not sure what might be causing this, but if agigliotti's solution is working, you can use that... but as far as I know, prat1507's expression should not change after reload
- Mark as New
- Bookmark
- Subscribe
- Mute
- Subscribe to RSS Feed
- Permalink
- Report Inappropriate Content
the bars should be thesame as in the picture, but they should still be coloured and not greyed out.
- Mark as New
- Bookmark
- Subscribe
- Mute
- Subscribe to RSS Feed
- Permalink
- Report Inappropriate Content
set also your color expression as custom by expression and type in Sum( {1} if(Dimension2 = 'ZZ', 15, Value) ).
- Mark as New
- Bookmark
- Subscribe
- Mute
- Subscribe to RSS Feed
- Permalink
- Report Inappropriate Content
Hey Andrea,
the problem is that I would like to define the colors manually:
if(Dimension2='XX', rgb(255,0,0),rgb(0,0,255))
Unfortunately i do not see any way to enhance that with a set analysis.