Unlock a world of possibilities! Login now and discover the exclusive benefits awaiting you.
- Qlik Community
- :
- All Forums
- :
- QlikView App Dev
- :
- Re: Issue with counts and filters
- Subscribe to RSS Feed
- Mark Topic as New
- Mark Topic as Read
- Float this Topic for Current User
- Bookmark
- Subscribe
- Mute
- Printer Friendly Page
- Mark as New
- Bookmark
- Subscribe
- Mute
- Subscribe to RSS Feed
- Permalink
- Report Inappropriate Content
Issue with counts and filters
Hello,
I am trying to create a statistic of linkages between IDs (PBGA_MASTER_ID) and vehicles (VEHICLE_ID) but at some point I lack understanding the relation between counts and set filters.e given below I want to have a summary of PBGA_MASTER_ID that are not having relation to a VEHICLE_ID (count<0 or NULL)
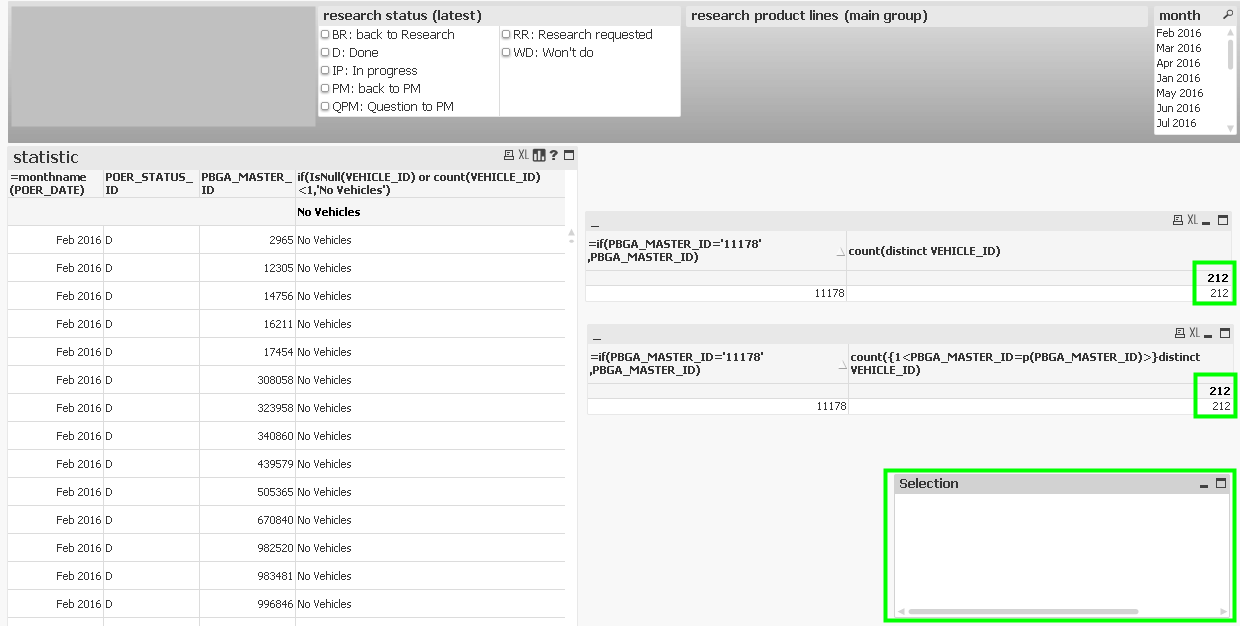
In this case I have a calculation of the vehicle count which works fine for both variants (as given in the boxes on the right):
count(distinct VEHICLE_ID)
count({1<PBGA_MASTER_ID=p(PBGA_MASTER_ID)>}distinct VEHICLE_ID)
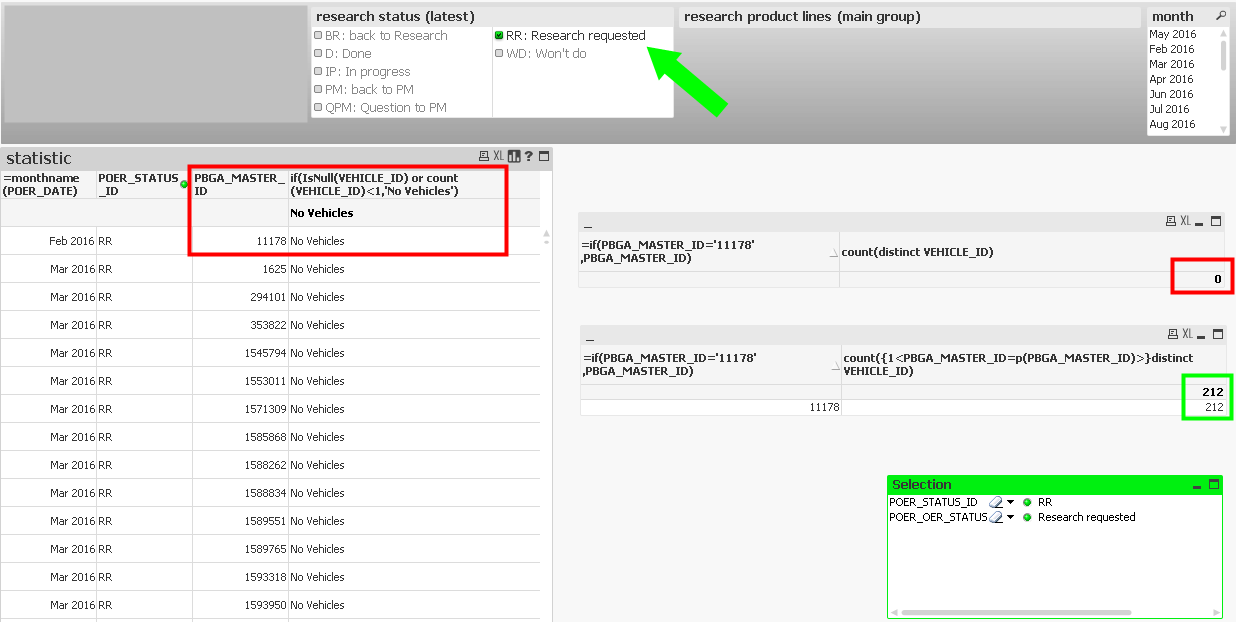
In the box statistic I try to show all PBGA_MASTER_ID without linkage to a VEHICLE_ID in a table (and later in a bar chart) aggregated over months. But when I am selecting a filter (green arrow) the first count on the right side (mentioned above) drops to 0 and the second count remains since I am delimiting the considered filters to PBGA_MASTER_ID.
Now I am struggling because I see the PBGA_MASTER_ID 11178 in the box statistic as having no vehicles linked by the expression:
if(IsNull(VEHICLE_ID) or count(VEHICLE_ID)<1,'No Vehicles')
Now I am struggling because I see the PBGA_MASTER_ID 11178 in the box statistic as having no vehicles linked by the expression:
if(IsNull(VEHICLE_ID) or count(VEHICLE_ID)<1,'No Vehicles')
This means that somehow the calculation is affected by the filter but I need to know how to create an expression that covers all PBGA_MASTER_IDs with VEHICLE_ID either 0 or NULL but also regards the selected filters.
How can I make 11178 disappear from the box statistic by counting the VEHICLE_IDs correctly?
All alternate States are set to <inherited>
Thanks in advance for any tips
- « Previous Replies
-
- 1
- 2
- Next Replies »
Accepted Solutions
- Mark as New
- Bookmark
- Subscribe
- Mute
- Subscribe to RSS Feed
- Permalink
- Report Inappropriate Content
May be all you need is to ignore selection in POER_STATUS_ID?
Try this:
Count(DISTINCT {<PBGA_MASTER_ID = {"=Count(DISTINCT {<POER_STATUS_ID>} VEHICLE_ID) = 0"}, POER_STATUS_ID>} PBGA_MASTER_ID)
or this
Count(DISTINCT {<PBGA_MASTER_ID = {"=Count(DISTINCT {<POER_STATUS_ID>} VEHICLE_ID) = 0"}>} PBGA_MASTER_ID)
- Mark as New
- Bookmark
- Subscribe
- Mute
- Subscribe to RSS Feed
- Permalink
- Report Inappropriate Content
If you want to make 11178 disappear, why not use count(distinct VEHICLE_ID) which was working the way you want? I think I am missing something, right? Why do you need to use this? count({1<PBGA_MASTER_ID=p(PBGA_MASTER_ID)>}distinct VEHICLE_ID)
- Mark as New
- Bookmark
- Subscribe
- Mute
- Subscribe to RSS Feed
- Permalink
- Report Inappropriate Content
When you say, "How can I make 11178 disappear?", do you mean just the text at that particular cell of the table or the entire row?
- Mark as New
- Bookmark
- Subscribe
- Mute
- Subscribe to RSS Feed
- Permalink
- Report Inappropriate Content
count(distinct VEHICLE_ID) brings up that 11178 has 0 VEHICLE_IDs linked as soon as the filter is set (second screenshot) but this count is wrong.
I can only force the correct count of 212 VEHICLE_IDs by
count({1<PBGA_MASTER_ID=p(PBGA_MASTER_ID)>}distinct VEHICLE_ID)
but I need the correct count in the chart "statistics" which I don't get as soon as a filter is set. In the chart "statistics" I would expect it not to appear since I only want PBGA_MASTER_ID in there that really have no linkage to a VEHICLE_ID.
- Mark as New
- Bookmark
- Subscribe
- Mute
- Subscribe to RSS Feed
- Permalink
- Report Inappropriate Content
The whole line since 11178 has vehicles and therefore it shouldn't appear. 212 is the correct count.
- Mark as New
- Bookmark
- Subscribe
- Mute
- Subscribe to RSS Feed
- Permalink
- Report Inappropriate Content
What if you do this
If(IsNull(VEHICLE_ID) or Count({1<PBGA_MASTER_ID=p(PBGA_MASTER_ID)>} DISTINCT VEHICLE_ID) < 1, 'No Vehicles')
- Mark as New
- Bookmark
- Subscribe
- Mute
- Subscribe to RSS Feed
- Permalink
- Report Inappropriate Content
I'm still not quite sure what you need, but from what I can gather: you don't want to display rows on the table based upon some value (or lack thereof) of a measure calculated on the row's dimensional values. So, whenever, the measure is calculated to 0 (or null) you want to suppress the row of the table. Does this sound right?
One thing you could do is create a calculated dimension using the AGGR function, which will produce Null in those cases where there are no "vehicles". Then unselect, "Include null values" from the options of the dimension (I use Qlik Sense, but I assume the options are the same).
So something like:
Aggr(if(IsNull(VEHICLE_ID) or count(VEHICLE_ID)<1,Null(), count(distinct VEHICLE_iD)), PBGA_MASTER_ID)
This will produce a column with the counts of distinct vehicle ids or Null if there aren't any. If it's a dimension, you can suppress nulls.
Let me know if it works.
Jonathan
- Mark as New
- Bookmark
- Subscribe
- Mute
- Subscribe to RSS Feed
- Permalink
- Report Inappropriate Content
Sadly no positive effect. Even if I try to cut the expression down to
If(IsNull(VEHICLE_ID) or Count({1<PBGA_MASTER_ID=p(PBGA_MASTER_ID)>} DISTINCT VEHICLE_ID) < 1, 'No Vehicles')
11178 appears.
Maybe you have an idea and more insight if I explain what I finally want:
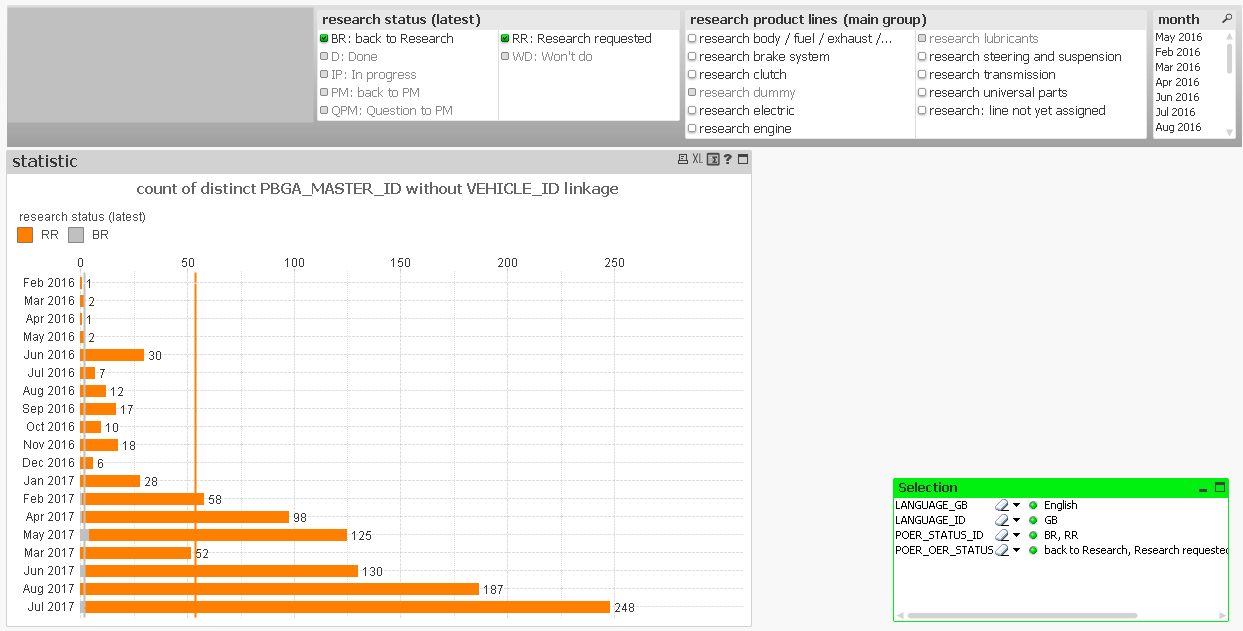
I want to have a bar chart that
- aggregates the count of PBGA_MASTER_IDs without vehicle linkage
- over months
- regarding the filter set in the active sheet
But since e.g. 11178 always appears which actually has vehicle linkages I failed by now.
In the following picture you can see my desired output but the only value for Feb 2016 is 11178 which indeed has 212 vehicle linkages.
Maybe we can alter your suggested expression to make it work.
- Mark as New
- Bookmark
- Subscribe
- Mute
- Subscribe to RSS Feed
- Permalink
- Report Inappropriate Content
Sorry for being ambiguous but I want it the other way round. I only want to see the
- PBGA_MASTER_ID where
- count(VEHICLE_ID) is NULL
- or
- isnull(VEHICLE_ID)
to use it in a bar chart (you can see a more detailed explanation in my last reply to Sunny Talwar). But strangely the PBGA_MASTER_ID 11178 pretends to have no VEHICLE_ID linkages as soon as a filter is set while before setting a filter it had 212 VEHICLE_IDs..
- Mark as New
- Bookmark
- Subscribe
- Mute
- Subscribe to RSS Feed
- Permalink
- Report Inappropriate Content
Thanks for more information,
I'm sure that Sunny will give a non-AGGR response. But this might work:
You want an if-statement to determine if a master-id is linked to any vehicle ids. This aggr function will do that for each master_id.
Aggr(If (Count(distinct VEHICLE_ID) > 0, 1, 0), PBGA_MASTER_ID).
You need to wrap this virtual table from the Aggr function (master ids by distinct vehicle count) in an aggregation function, count.
Count(Aggr(If (Count(distinct VEHICLE_ID) > 0, 1, 0), PBGA_MASTER_ID))
(Note, I still am not quite sure what you need regarding user selections, but since I'm not specifying in set analysis it will take user selections.)
- « Previous Replies
-
- 1
- 2
- Next Replies »