Unlock a world of possibilities! Login now and discover the exclusive benefits awaiting you.
- Qlik Community
- :
- All Forums
- :
- QlikView App Dev
- :
- Google Map displays as Color smear?
- Subscribe to RSS Feed
- Mark Topic as New
- Mark Topic as Read
- Float this Topic for Current User
- Bookmark
- Subscribe
- Mute
- Printer Friendly Page
- Mark as New
- Bookmark
- Subscribe
- Mute
- Subscribe to RSS Feed
- Permalink
- Report Inappropriate Content
Google Map displays as Color smear?
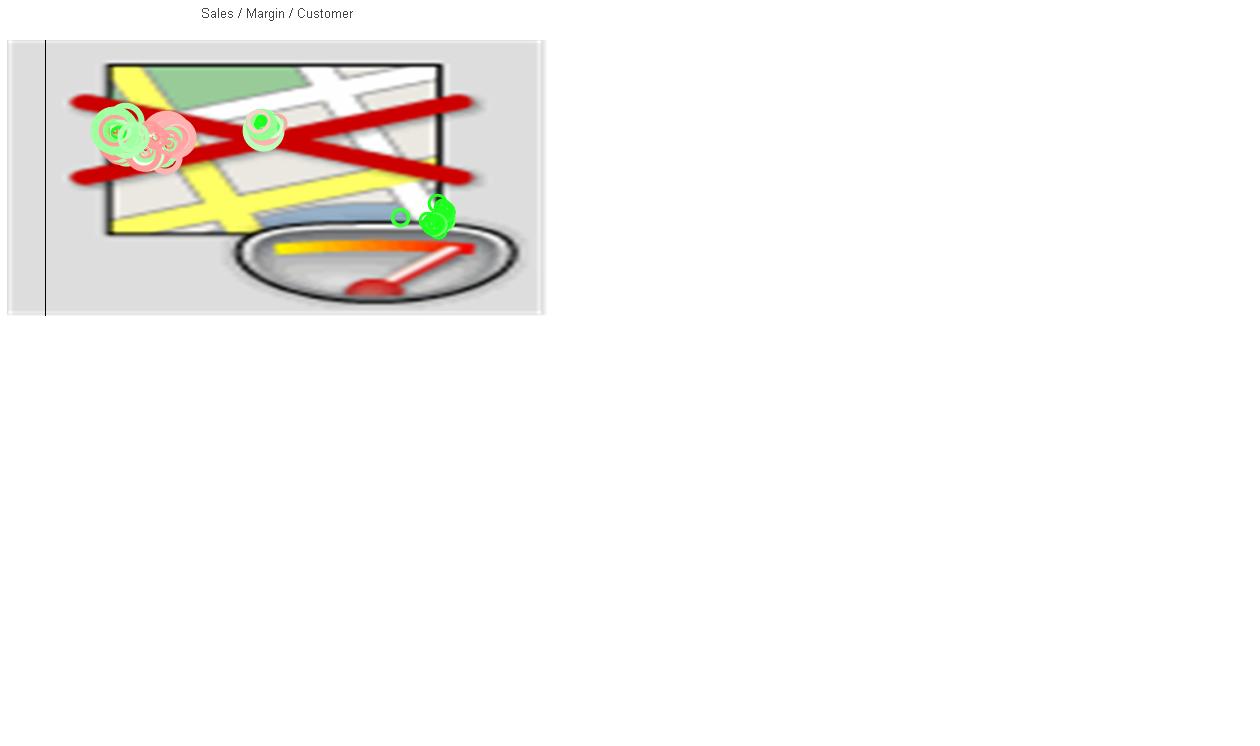
I was just able to get the Google map to work in my application using my data. then about 10 minutes ago for no reason, the map stated showing like this:

Anyone have any ideas to the cause? Their website says that is is unlimited views...
Also if I now open the Online Sales demo that comes with personal edition that map there is displaying this:
Update:
My Map chart just changes to this: Do not know what this means. Same as before but now without red or green?
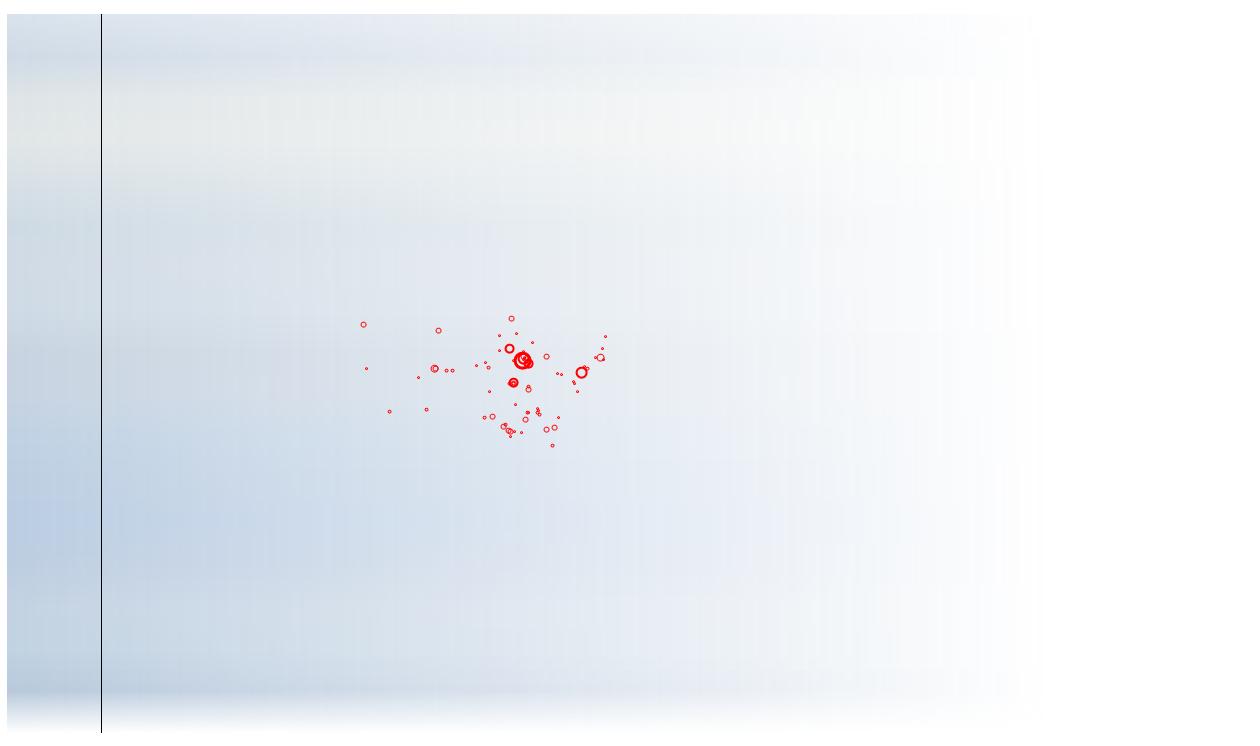
Apparently this is directly related to my machine? I restarted and the map shows up again, however the data now is shifted in the scatter chart causing the points to be in the wrong spot. As soon as I select a data point, it zooms in and shows correctly.
 As you can see it is plotting points that should be in Flordia, in the Gulf of Mexico
- Mark as New
- Bookmark
- Subscribe
- Mute
- Subscribe to RSS Feed
- Permalink
- Report Inappropriate Content
Hi,
Let me tell you one thing. Google placed a limitation on usage of google map in a day by a user.
Read this.
Usage Limits
Use of the Google Static Maps API is subject to a query limit of 1000 unique (different) image requests per viewer per day. Since this restriction is a quota per viewer, most developers should not need to worry about exceeding their quota. However, note that we enforce an additional request rate limit to prevent abuse of the service. Requests of identical images, in general, do not count towards this limit beyond the original request.
If a user exceeds the limit as proscribed above, the following image will be displayed indicating that the quota has been exceeded:
This limit is enforced to prevent abuse and/or repurposing of the Static Maps API, and this limit may be changed in the future without notice. If you exceed the 24-hour limit or otherwise abuse the service, the Static Maps API may stop working for you temporarily. If you continue to exceed this limit, your access to the Static Maps API may be blocked.
Static Map URLs are restricted to 2048 characters in size. In practice, you will probably not have need for URLs longer than this, unless you produce complicated maps with a high number of markers and paths. Note, however, that certain characters may be URL-encoded by browsers and/or services before sending them off to the Static Map service, resulting in increased character usage. For more information, see Building a Valid URL.
For more info on Static google map visit link below.
http://code.google.com/apis/maps/documentation/staticmaps/
" Apparently this is directly related to my machine? I restarted and the map shows up again, however the data now is shifted in the scatter chart causing the points to be in the wrong spot. As soon as I select a data point, it zooms in and shows correctly. "
Fot this you need to adjust the chart and the zoom to match with your data points.
Hope this helps.
Regards,
Kaushik Solanki
- Mark as New
- Bookmark
- Subscribe
- Mute
- Subscribe to RSS Feed
- Permalink
- Report Inappropriate Content
Kaushik,
Thank you for the information. I did see that there is the data limit that causes the chart to display a red X, I was just wondering about the other images that I posted. Somehow they appear, then if I (Chat is currently in a container) remove the chart from the container it displays again.
As far as adjusting the chart and zoom, where could I look to find out what formulas I need to change? The calculations that are used to determine this are very complex, and I do not know where to begin looking for which numbers to change.
My chart is currently 757 x 757. I adjusted the chart size to this in the load script, I just have no idea what else to change.
Thank you,
Marc
Edit: Here is my current select statement for the google map.
max_zoom_level = 14; //maximum value 17
def_zoom_level = 1;
def_map_size = 757;
// Variables required for calculating map
// No need to change these
var_pi180= '=pi()/180';
var_lat_offset= '0';
var_long_offset= '0';
var_mc2= '=256*pow(2,$(var_zoom))';
var_mc1= '=256*pow(2,($(var_zoom)-1))';
var_mid_lat= '=median(Latitude)';
var_mid_long= '=median(Longitude)';
var_zoom= '=If(max(aggr(if(max( round(256*pow(2,(_zoom_level -1)))+( Longitude *((256*pow(2,_zoom_level
))/360)) )-min( round(256*pow(2,(_zoom_level -1)))+( Longitude *((256*pow(2,_zoom_level ))/360)) )
<def_map_size AND max((256*pow(2,(_zoom_level-1)))+((0.5*log((1+(sin((Latitude)*pi()/180)))/(1-
(sin((Latitude)*pi()/180)))))*((-256*pow(2,_zoom_level))/(2*pi()))))-min((256*pow(2,(_zoom_level-
1)))+((0.5*log((1+(sin((Latitude)*pi()/180)))/(1-(sin((Latitude)*pi()/180)))))*((-
256*pow(2,_zoom_level))/(2*pi()))))<def_map_size,_zoom_level,null()),_zoom_level))>def_zoom_level,
max(aggr(if(max( round(256*pow(2,(_zoom_level -1)))+( Longitude *((256*pow(2,_zoom_level ))/360)) )-min(
round(256*pow(2,(_zoom_level -1)))+( Longitude *((256*pow(2,_zoom_level ))/360)) ) <def_map_size AND
max((256*pow(2,(_zoom_level-1)))+((0.5*log((1+(sin((Latitude)*pi()/180)))/(1-(sin((Latitude)*pi()/180)))))*((-
256*pow(2,_zoom_level))/(2*pi()))))-min((256*pow(2,(_zoom_level-
1)))+((0.5*log((1+(sin((Latitude)*pi()/180)))/(1-(sin((Latitude)*pi()/180)))))*((-
256*pow(2,_zoom_level))/(2*pi()))))<def_map_size,_zoom_level,null()),_zoom_level)),def_zoom_level)';
var_maptype= '=if(isnull(only(maptype)),fieldvalue( '&chr(39)&'maptype'&chr(39)&', 4 ),maptype)';
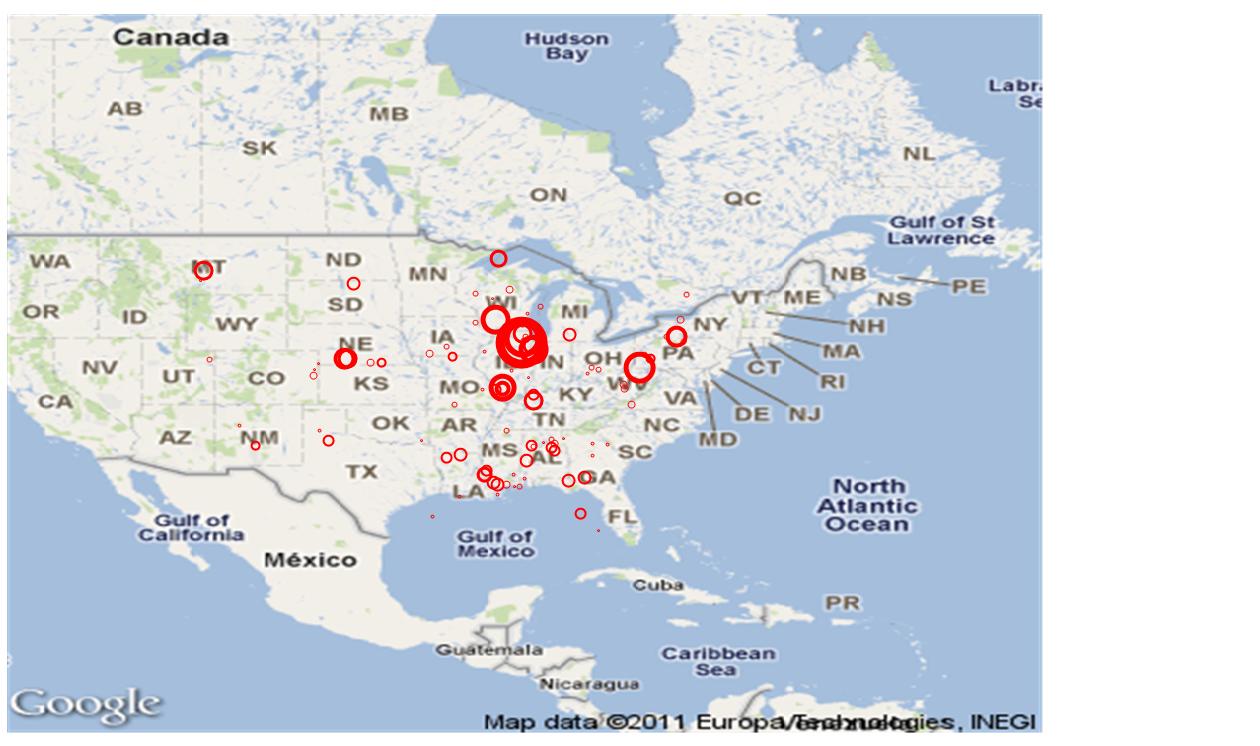
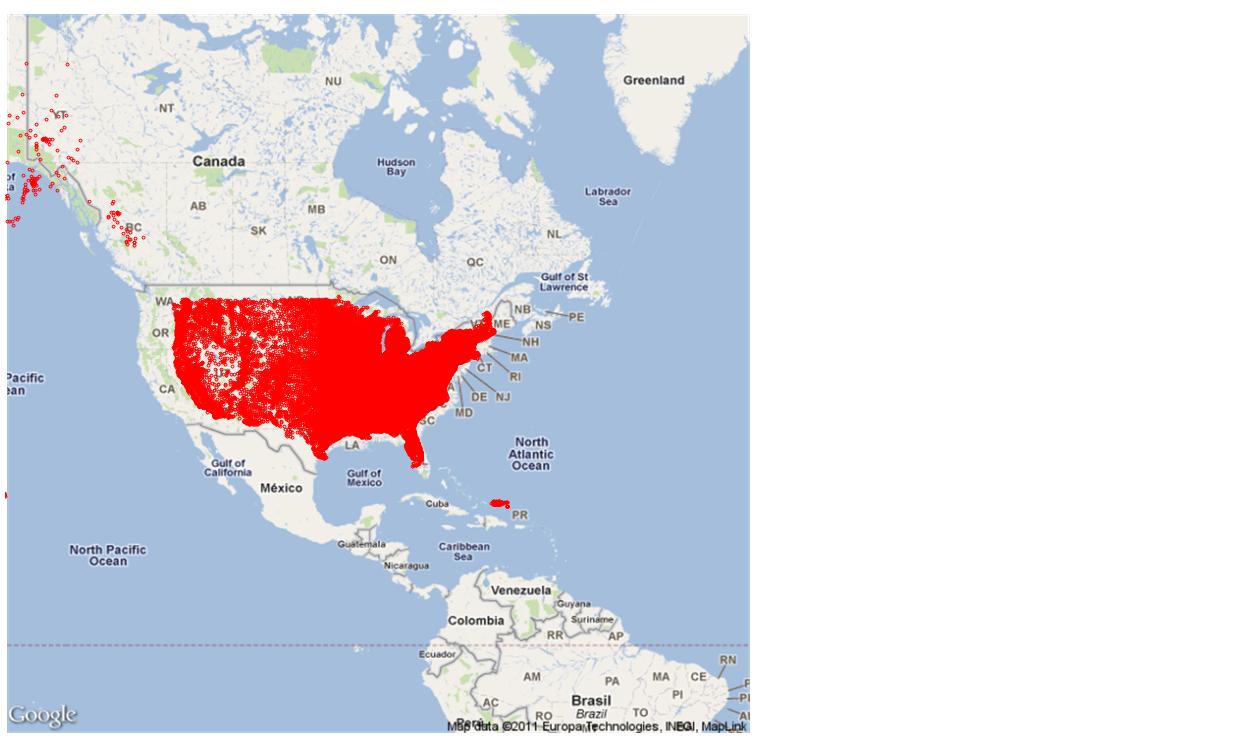
Here is how the current map looks. The red dots should be the same size as the US. I can tell it is something where my data has a lower zoom level than the Map, but how can I fix it?

Better View of how it is currently plotting:
- Mark as New
- Bookmark
- Subscribe
- Mute
- Subscribe to RSS Feed
- Permalink
- Report Inappropriate Content
Ich werde ab 05.09.2011 nicht im Büro sein. Ich kehre zurück am
23.09.2011.
Ich werde Ihre Nachrichten nach meiner Rückkehr beantworten.
Diese E-Mail kann Betriebs- oder Geschäftsgeheimnisse oder sonstige vertrauliche Informationen enthalten. Sollten Sie diese E-Mail irrtümlich erhalten haben, ist Ihnen eine Verwertung des Inhalts, eine Vervielfältigung oder Weitergabe der E-Mail ausdrücklich untersagt.
Bitte benachrichtigen Sie uns und vernichten Sie die empfangene E-Mail. Vielen Dank!