Unlock a world of possibilities! Login now and discover the exclusive benefits awaiting you.
- Qlik Community
- :
- All Forums
- :
- QlikView App Dev
- :
- Two dimensions, two expressions, stacked bar and l...
- Subscribe to RSS Feed
- Mark Topic as New
- Mark Topic as Read
- Float this Topic for Current User
- Bookmark
- Subscribe
- Mute
- Printer Friendly Page
- Mark as New
- Bookmark
- Subscribe
- Mute
- Subscribe to RSS Feed
- Permalink
- Report Inappropriate Content
Two dimensions, two expressions, stacked bar and line chart?
Dear community,
I have a combo chart with two dimensions, Month and Sub-WorkCentre.
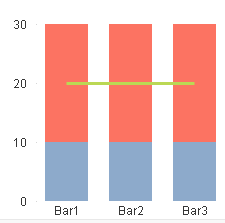
The first of my expressions is a stacked bar chart which simply sums the output Hours per Sub-WorkCentre.
In my second expression I want to show a total capacity line for Main-WorkCentre. We only record capacity at the Main level, the expression is below:
sum(TOTAL <Week> {<Activity={'Capacity'}>} Hours)
However when I try to apply this my stacked bar chart turns to a grouped bar chart with the total capacity line.
Is there a way to get my first expression to stack?
Thanks,
Keith
- Mark as New
- Bookmark
- Subscribe
- Mute
- Subscribe to RSS Feed
- Permalink
- Report Inappropriate Content
Can you show image which currently having?
- Mark as New
- Bookmark
- Subscribe
- Mute
- Subscribe to RSS Feed
- Permalink
- Report Inappropriate Content
Hi Anil,
My chart has gone from this:
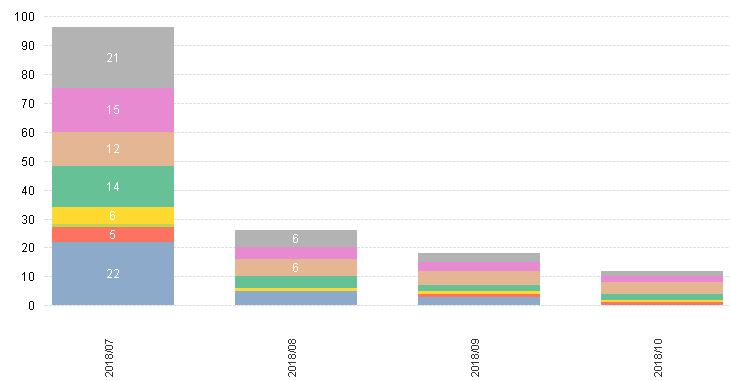
To this once I introduce the capacity line:
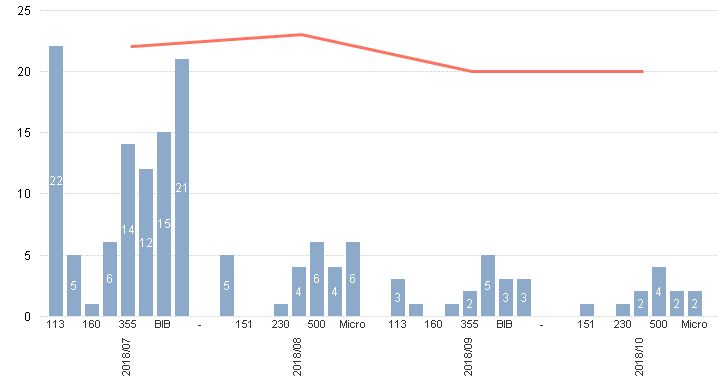
I would like to keep the bars stacked and show the total line running across.
Thanks,
Keith
- Mark as New
- Bookmark
- Subscribe
- Mute
- Subscribe to RSS Feed
- Permalink
- Report Inappropriate Content
After changing to "Combo chart", are you selection "Stacked" from the "Style"tab?
- Mark as New
- Bookmark
- Subscribe
- Mute
- Subscribe to RSS Feed
- Permalink
- Report Inappropriate Content
The idea is here Exclude Zero bars
- Mark as New
- Bookmark
- Subscribe
- Mute
- Subscribe to RSS Feed
- Permalink
- Report Inappropriate Content
Hi Anil,
I don't have an issue with the zero/null bar. The question is why the bar chart has moved from stacked to grouped. Apologies if I am missing something from the link you posted above.
Thanks,
Keith
- Mark as New
- Bookmark
- Subscribe
- Mute
- Subscribe to RSS Feed
- Permalink
- Report Inappropriate Content
Thanks Sunny. Marked as answered now.
Sunny, sorry to ask but I also posted the question below yesterday.
I recall reading a thread posted by someone else with a similar issue which you answered.... but I can't seem to find it. If not too much trouble would you mind having a look at my thread? Many thanks again, Keith
Two dimensions, two expressions, stacked bar and line chart?
- Mark as New
- Bookmark
- Subscribe
- Mute
- Subscribe to RSS Feed
- Permalink
- Report Inappropriate Content
May be share sample that case, Because i don't have any thing issue using Combo chart?