Unlock a world of possibilities! Login now and discover the exclusive benefits awaiting you.
- Qlik Community
- :
- All Forums
- :
- QlikView App Dev
- :
- Adding some custom lines in my chart
- Subscribe to RSS Feed
- Mark Topic as New
- Mark Topic as Read
- Float this Topic for Current User
- Bookmark
- Subscribe
- Mute
- Printer Friendly Page
- Mark as New
- Bookmark
- Subscribe
- Mute
- Subscribe to RSS Feed
- Permalink
- Report Inappropriate Content
Adding some custom lines in my chart
Hi.
I have chart with 2 dimension and 2 expression columns. In this chart I need to add 3 lines(one above(first line in chart) and two at the end). If you want analogy - like total line, but calculated thru custom expression and it have to be 3 of them, not just one top or buttom.
I think it can be achived thru pseudo data in load script:
concantinate
load field1, field2, val
inline [
field1, field2, val
'-','Custom line1',0
'-','Custom line2',0
'-','Custom line3',0
];
But may be it can be solved thru calculated dimendions or some other way?
- Mark as New
- Bookmark
- Subscribe
- Mute
- Subscribe to RSS Feed
- Permalink
- Report Inappropriate Content
Hi,
As i understand it you want to add a perticular calculated line if this so i suggest you use the Reference lines or Text in chart option from there you calculate your value also.
From Presentation tab you get all this settings.
Regards
Anand
- Mark as New
- Bookmark
- Subscribe
- Mute
- Subscribe to RSS Feed
- Permalink
- Report Inappropriate Content
anandrjs thx for reply.
Sorry for my english. I am using Straight Table Chart. By line i mean row of data in table.
- Mark as New
- Bookmark
- Subscribe
- Mute
- Subscribe to RSS Feed
- Permalink
- Report Inappropriate Content
Hi,
A type of row means single row which type of it is ,could you clear it more, do you have any sample file please share it.
Regards,
Anand
- Mark as New
- Bookmark
- Subscribe
- Mute
- Subscribe to RSS Feed
- Permalink
- Report Inappropriate Content
Ok.
I need table like this
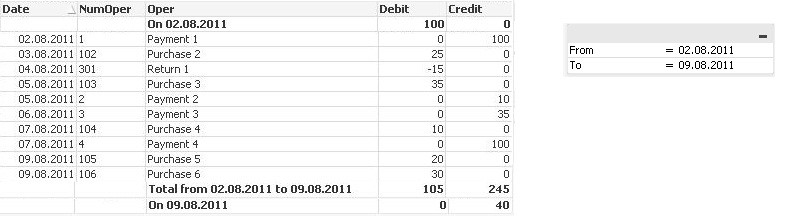
Bold rows is what i desire 
Hire is my test file and data soure. Note that there is only one client, in real data model there is 1000+ and expressions is slightly difrent, but idea is same.
- Mark as New
- Bookmark
- Subscribe
- Mute
- Subscribe to RSS Feed
- Permalink
- Report Inappropriate Content
Anybody?
At least give me direction how you should make that kind of things in qlikview.
- Mark as New
- Bookmark
- Subscribe
- Mute
- Subscribe to RSS Feed
- Permalink
- Report Inappropriate Content
Hi,
I achieved as said please go through the attached qvw file.
Niranjan M.
- Mark as New
- Bookmark
- Subscribe
- Mute
- Subscribe to RSS Feed
- Permalink
- Report Inappropriate Content
Thx for reply Niranjan.
I did simular thing. But there is several problems:
1. If you select particular client this special rows wold not be displayed.
2. If you chose date "from" earlier than 1st record you get "-"(null data) instead needed 1st row. Simular thing with "To" date.
I will try to resolv them in near future.