Unlock a world of possibilities! Login now and discover the exclusive benefits awaiting you.
- Qlik Community
- :
- All Forums
- :
- QlikView App Dev
- :
- Re: Count help?
- Subscribe to RSS Feed
- Mark Topic as New
- Mark Topic as Read
- Float this Topic for Current User
- Bookmark
- Subscribe
- Mute
- Printer Friendly Page
- Mark as New
- Bookmark
- Subscribe
- Mute
- Subscribe to RSS Feed
- Permalink
- Report Inappropriate Content
Count help?
Dear All,
I'm having below case:

One line cab belong to different stations , in above case it is 3.
So what I'm looking for is count of "Global Station Label" but need to include line count too.
As of now I'm using below expression:
=count(DISTINCT {<Month=,Week=,Day=,Type_Name=,Why_Name=,Standard_Name=,Technology-={'No Fuel BM','No SCR inj'}>}Global Station Label)
How should I include here count of line???
I'm not looking for simply * above expression with count(Line) , I need somehow "And" condition to consider both factors.
Please suggest!
Regards,
AS
- Tags:
- qlikview_scripting
- « Previous Replies
-
- 1
- 2
- Next Replies »
- Mark as New
- Bookmark
- Subscribe
- Mute
- Subscribe to RSS Feed
- Permalink
- Report Inappropriate Content
Sorry Sunny not possible 
Regards,
AS
- Mark as New
- Bookmark
- Subscribe
- Mute
- Subscribe to RSS Feed
- Permalink
- Report Inappropriate Content
Don't know any other way to help.... may be someone else can help 
- Mark as New
- Bookmark
- Subscribe
- Mute
- Subscribe to RSS Feed
- Permalink
- Report Inappropriate Content
anyways thanks a lot for trying ur best as always
Truly appreciated!
Regards,
AS
- Mark as New
- Bookmark
- Subscribe
- Mute
- Subscribe to RSS Feed
- Permalink
- Report Inappropriate Content
No problem at all Amit
- Mark as New
- Bookmark
- Subscribe
- Mute
- Subscribe to RSS Feed
- Permalink
- Report Inappropriate Content
Luckily got some sample data.
PFA!
Regards,
AS
- Mark as New
- Bookmark
- Subscribe
- Mute
- Subscribe to RSS Feed
- Permalink
- Report Inappropriate Content
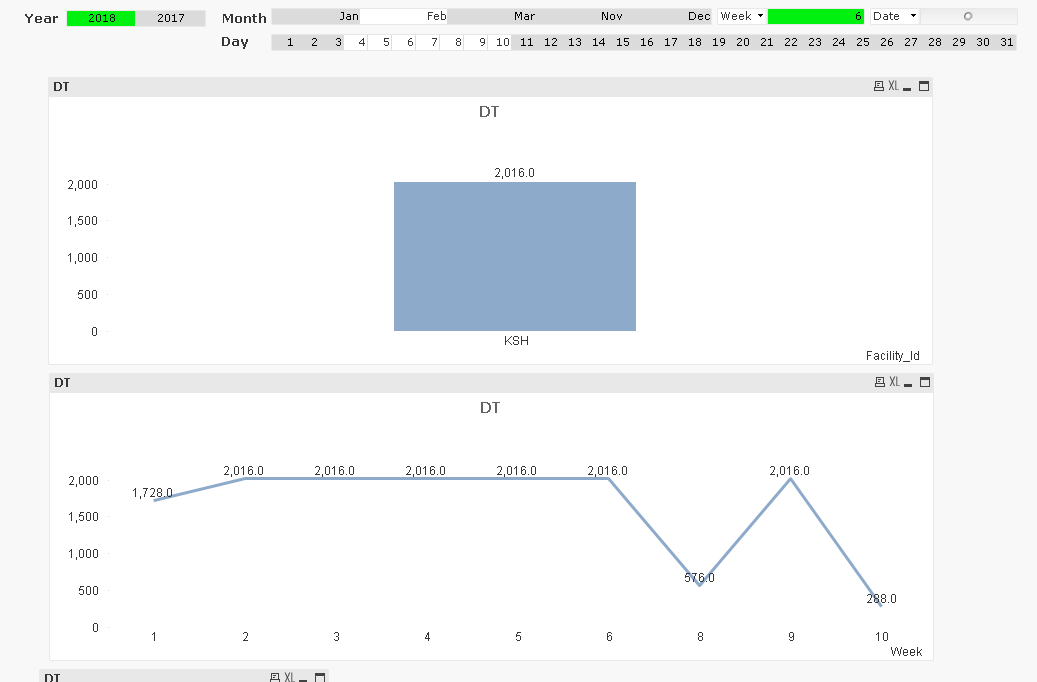
In general i should be able to see 2016 on week 6 in line chart and not 1176.

Regards,
AS
- Mark as New
- Bookmark
- Subscribe
- Mute
- Subscribe to RSS Feed
- Permalink
- Report Inappropriate Content
Try this
=Sum({<Month=,Week=,Day=,Type_Name=,Why_Name=,Standard_Name=,Line_Name=>}Aggr(
Count(DISTINCT {<Month=,Week=,Day=,Type_Name=,Why_Name=,Standard_Name=,Line_Name=>}Day)*
Count(TOTAL <Facility_Id> DISTINCT {<Month=,Week=,Day=,Type_Name=,Why_Name=,Standard_Name=>}Station_Label & Line_Name)*24, Facility_Id, Week))
- Mark as New
- Bookmark
- Subscribe
- Mute
- Subscribe to RSS Feed
- Permalink
- Report Inappropriate Content
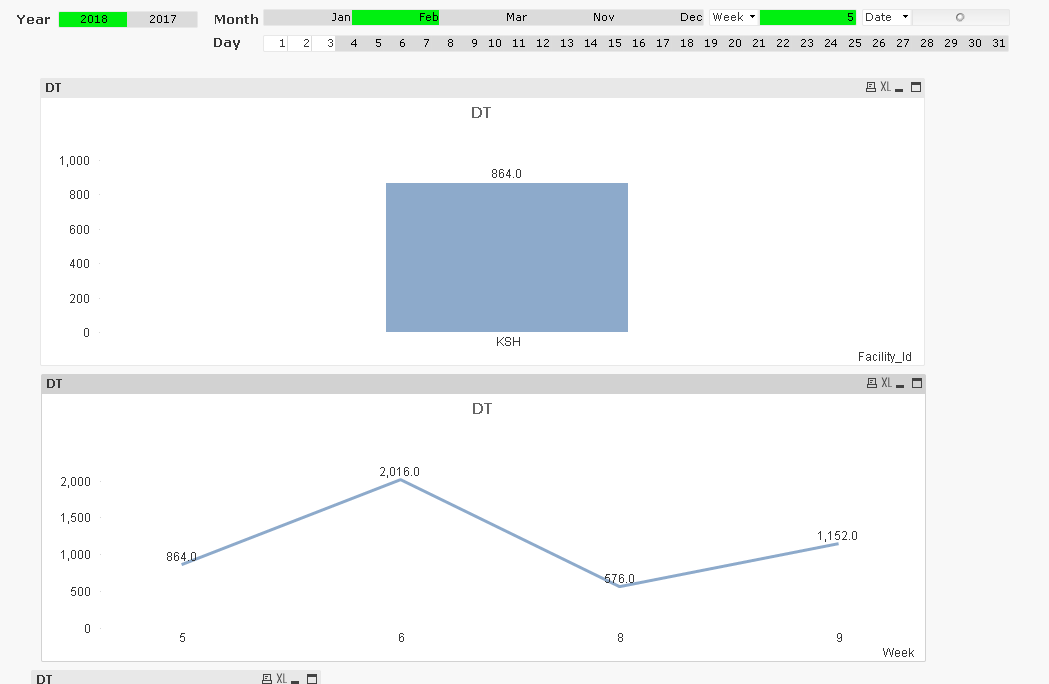
No Sunny not like this:
Different Week values will keep changing on bar charts and same values it should show in line for respective week.
Example for Week 5 its 864 , but in line chart it shows 2016 which is wrong.

Thanks,
AS
- Mark as New
- Bookmark
- Subscribe
- Mute
- Subscribe to RSS Feed
- Permalink
- Report Inappropriate Content
I don't really know what you need... but you were ignoring selection in Month field and in your image you have selected Feb... which is still impacting your top chart, but not the bottom chart.... For me, right now, it is just a guessing game... you will need to elaborate on what you need
- Mark as New
- Bookmark
- Subscribe
- Mute
- Subscribe to RSS Feed
- Permalink
- Report Inappropriate Content
sorry forgot selection on Month.
Thanks,
AS
- « Previous Replies
-
- 1
- 2
- Next Replies »