Unlock a world of possibilities! Login now and discover the exclusive benefits awaiting you.
- Qlik Community
- :
- Forums
- :
- Analytics
- :
- New to Qlik Analytics
- :
- Re: Show column values conditionally?
- Subscribe to RSS Feed
- Mark Topic as New
- Mark Topic as Read
- Float this Topic for Current User
- Bookmark
- Subscribe
- Mute
- Printer Friendly Page
- Mark as New
- Bookmark
- Subscribe
- Mute
- Subscribe to RSS Feed
- Permalink
- Report Inappropriate Content
Show column values conditionally?
Hi,
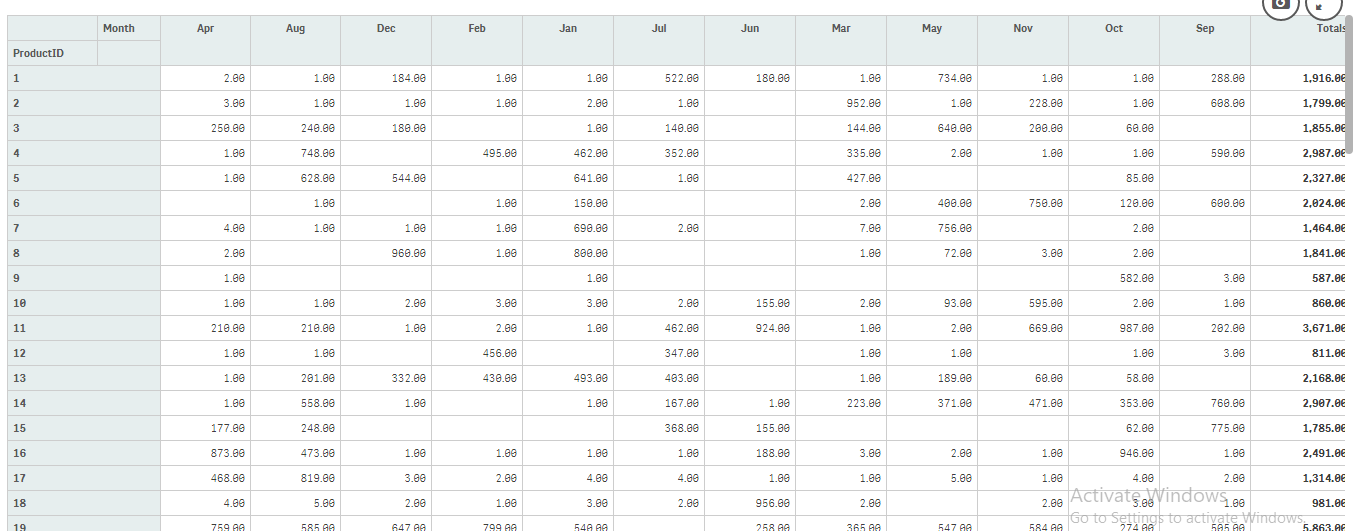
I have a data table which shows monthly sales in a grid, i.e. 12 columns, plus a total in 13th column.
Using set analysis, it correctly shows the total of the selected months, e.g when Jan, Feb selected it will only show Jan+Feb numbers, however other months' figures are still displayed in the grid, which is confusing / wrong to look at.
What syntax would I use to have the 'unselected' months show a blank column?
Jan expression is : Sum({$<[FiscalPeriodText]={'3~January'}>}ExtPrice)
Feb expression is : Sum({$<[FiscalPeriodText]={'4~February'}>}ExtPrice)
Total expression is: Sum(ExtPrice)
Screen shot attached.
(3 and 4 are our fiscal month numbers).
thanks.
- Mark as New
- Bookmark
- Subscribe
- Mute
- Subscribe to RSS Feed
- Permalink
- Report Inappropriate Content
Hi,
Why don't you make a pivot with the months as columns, thereby having the selections will referenced in the columns showing as you intend? It also has an automatic 'total' function.
- Mark as New
- Bookmark
- Subscribe
- Mute
- Subscribe to RSS Feed
- Permalink
- Report Inappropriate Content
Thanks for your reply. I was hoping this could be done without a pivot, but perhaps not.....
I'm now trying this, however, I can't see how to get the yearly total on the right most column and also the total at the top of each column for all sales for a give month (easy in a normal table but can't see how to in pivot)
Stephen
- Mark as New
- Bookmark
- Subscribe
- Mute
- Subscribe to RSS Feed
- Permalink
- Report Inappropriate Content
Do you get the filters to work if you disable the total expression?
- Mark as New
- Bookmark
- Subscribe
- Mute
- Subscribe to RSS Feed
- Permalink
- Report Inappropriate Content
Hi,
can you try JSPivotTable Extension.
Qlik Sense - Pivot Table Extension
Use Month also as Dimension and One Expression for all the Months.
- Mark as New
- Bookmark
- Subscribe
- Mute
- Subscribe to RSS Feed
- Permalink
- Report Inappropriate Content
No, I'm afraid this didn't make a difference, thanks for your reply
- Mark as New
- Bookmark
- Subscribe
- Mute
- Subscribe to RSS Feed
- Permalink
- Report Inappropriate Content
Thanks for your reply. I will certainly look at this, but I'm new to Qlik and haven't done anything with extension. I think I may be unable to as I'm using Qlik Cloud (Business), rather than having it installed on my PC.
Thanks.
- Mark as New
- Bookmark
- Subscribe
- Mute
- Subscribe to RSS Feed
- Permalink
- Report Inappropriate Content
I have found how to get row total (albeit it's on the left hand side) but not at the top, yet. Thanks again.