Unlock a world of possibilities! Login now and discover the exclusive benefits awaiting you.
- Qlik Community
- :
- All Forums
- :
- QlikView App Dev
- :
- Re: Cross Table / Generic
- Subscribe to RSS Feed
- Mark Topic as New
- Mark Topic as Read
- Float this Topic for Current User
- Bookmark
- Subscribe
- Mute
- Printer Friendly Page
- Mark as New
- Bookmark
- Subscribe
- Mute
- Subscribe to RSS Feed
- Permalink
- Report Inappropriate Content
Cross Table / Generic
Hi All,
I have table like INPUT what is the best way to change like OUTPUT
INPUT
| ID | Type | Value |
|---|---|---|
| 1 | A | 2.5 |
| 1 | B | 3 |
| 2 | A | 2.6 |
| 2 | B | 4.5 |
| 3 | A | 5 |
| 3 | B | 5.5 |
| 4 | A | 4 |
| 4 | B | 4.1 |
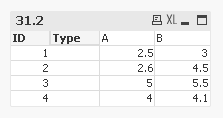
OUTPUT
| ID | A | B |
|---|---|---|
| 1 | 2.5 | 3 |
| 2 | 2.6 | 4.5 |
| 3 | 5 | 5.5 |
| 4 | 4 | 4.1 |
Accepted Solutions
- Mark as New
- Bookmark
- Subscribe
- Mute
- Subscribe to RSS Feed
- Permalink
- Report Inappropriate Content
Try this
Table:
LOAD * INLINE [
ID, Type, Value
1, A, 2.5
1, B, 3
2, A, 2.6
2, B, 4.5
3, A, 5
3, B, 5.5
4, A, 4
4, B, 4.1
];
FinalTable:
LOAD Distinct ID
Resident Table;
FOR i = 1 to FieldValueCount('Type')
LET vType = FieldValue('Type', $(i));
Left Join (FinalTable)
LOAD Distinct ID,
Value as [$(vType)]
Resident Table
Where Type = '$(vType)';
NEXT
DROP Table Table;
- Mark as New
- Bookmark
- Subscribe
- Mute
- Subscribe to RSS Feed
- Permalink
- Report Inappropriate Content
I think you already gave the answer. Use Generic Load
Generic
LOAD ID, Type, Value
FROM [https://community.qlik.com/thread/305091]
(html, codepage is 1252, embedded labels, table is @1);
OUTPUT:

- Mark as New
- Bookmark
- Subscribe
- Mute
- Subscribe to RSS Feed
- Permalink
- Report Inappropriate Content
Use generic load you will get expected output.
- Mark as New
- Bookmark
- Subscribe
- Mute
- Subscribe to RSS Feed
- Permalink
- Report Inappropriate Content
Why don't you just use a pivot table chart. Like
Add pivot table
Dim: ID, Type
Expr: = Sum(Value)
Then drag your Type column to top of expr like below:
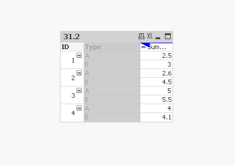
once you drag your Type field you can see like below
- Mark as New
- Bookmark
- Subscribe
- Mute
- Subscribe to RSS Feed
- Permalink
- Report Inappropriate Content
I agree, why not use Pivot table?
- Mark as New
- Bookmark
- Subscribe
- Mute
- Subscribe to RSS Feed
- Permalink
- Report Inappropriate Content
I need this transformation in script level so cant use pivot option,when i use generic option it create separate table.how can i concatenate automatically?
- Mark as New
- Bookmark
- Subscribe
- Mute
- Subscribe to RSS Feed
- Permalink
- Report Inappropriate Content
Try this
Table:
LOAD * INLINE [
ID, Type, Value
1, A, 2.5
1, B, 3
2, A, 2.6
2, B, 4.5
3, A, 5
3, B, 5.5
4, A, 4
4, B, 4.1
];
FinalTable:
LOAD Distinct ID
Resident Table;
FOR i = 1 to FieldValueCount('Type')
LET vType = FieldValue('Type', $(i));
Left Join (FinalTable)
LOAD Distinct ID,
Value as [$(vType)]
Resident Table
Where Type = '$(vType)';
NEXT
DROP Table Table;