Unlock a world of possibilities! Login now and discover the exclusive benefits awaiting you.
- Qlik Community
- :
- All Forums
- :
- QlikView App Dev
- :
- Re: How do I show % in Barchart? - Updated..
- Subscribe to RSS Feed
- Mark Topic as New
- Mark Topic as Read
- Float this Topic for Current User
- Bookmark
- Subscribe
- Mute
- Printer Friendly Page
- Mark as New
- Bookmark
- Subscribe
- Mute
- Subscribe to RSS Feed
- Permalink
- Report Inappropriate Content
How do I show % in Barchart? - Updated..
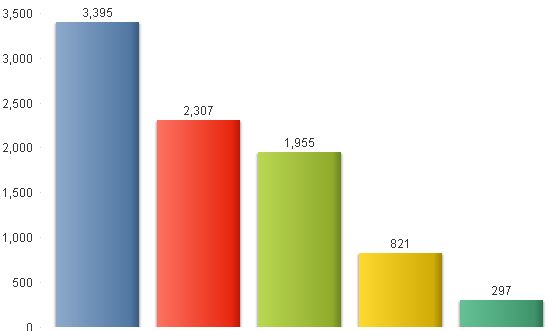
I have the following Barchart
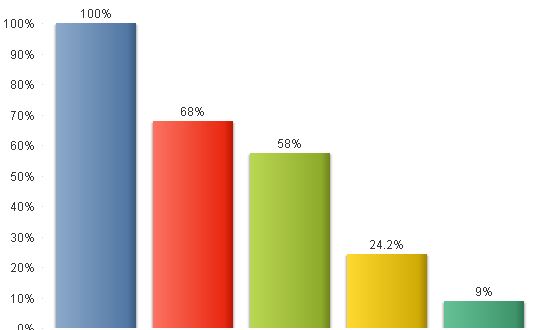
If I create a separate chart for % it will be look like below
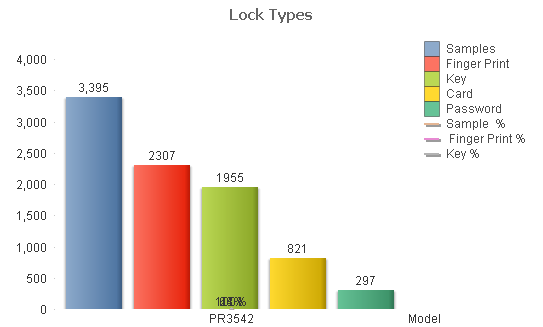
I want to combine this two (show numbers and % with in bar chat) into one chart. How do I do it?
Thanks
- « Previous Replies
-
- 1
- 2
- Next Replies »
Accepted Solutions
- Mark as New
- Bookmark
- Subscribe
- Mute
- Subscribe to RSS Feed
- Permalink
- Report Inappropriate Content
- Mark as New
- Bookmark
- Subscribe
- Mute
- Subscribe to RSS Feed
- Permalink
- Report Inappropriate Content
Having both expression in one chart (with toggle if needed) is one way to show both. If you want one bar with both values since one bar can have only one value one expression is to be made transparent. Like a combo chart with expression one as bar, expression two as line with value on data points, two scales and making 2nd expression color transparent.
Kiran Rokkam
- Mark as New
- Bookmark
- Subscribe
- Mute
- Subscribe to RSS Feed
- Permalink
- Report Inappropriate Content
Hi Kiran,
Thanks for the reply. At present I have a expression for individual bars. Also the upper limit is 355 for Y axis and if we add additional bar with % may not work.
Basically I want the chart look like below. How do I?
- Mark as New
- Bookmark
- Subscribe
- Mute
- Subscribe to RSS Feed
- Permalink
- Report Inappropriate Content
Write a % expression as line chart, enable value on data points and expression color transparent.
Regards,
Kiran
- Mark as New
- Bookmark
- Subscribe
- Mute
- Subscribe to RSS Feed
- Permalink
- Report Inappropriate Content
Kiran
Color Transparent: Where I should set? I tried clicking the Properties->Color-> then moving transparency slider from 0% to 100%. It is not helping.
ALso the values are overlapped. see below chart.
- Mark as New
- Bookmark
- Subscribe
- Mute
- Subscribe to RSS Feed
- Permalink
- Report Inappropriate Content
I thought your bars represent one expression. Since each bar itself is an expressions my earlier suggession wont work  . The option I see now is using text in chart. If I find another way I shall post.
Kiran.
- Mark as New
- Bookmark
- Subscribe
- Mute
- Subscribe to RSS Feed
- Permalink
- Report Inappropriate Content
I noticed there is a function called DUAL. Do you know whether I can use this in Barchart? How do I?
- Mark as New
- Bookmark
- Subscribe
- Mute
- Subscribe to RSS Feed
- Permalink
- Report Inappropriate Content
Hi
can u Upload ur file .so that i can try to work and find a solutions for ur query?
Regards,
Perumal
- Mark as New
- Bookmark
- Subscribe
- Mute
- Subscribe to RSS Feed
- Permalink
- Report Inappropriate Content
Hi Perumal
Thanks for the help. Here is the file
Perumal A wrote:
Hi
can u Upload ur file .so that i can try to work and find a solutions for ur query?
Regards,
Perumal
- Mark as New
- Bookmark
- Subscribe
- Mute
- Subscribe to RSS Feed
- Permalink
- Report Inappropriate Content
Hi.
I attached one file .please check it is correct or not .
- « Previous Replies
-
- 1
- 2
- Next Replies »