Unlock a world of possibilities! Login now and discover the exclusive benefits awaiting you.
- Qlik Community
- :
- All Forums
- :
- QlikView App Dev
- :
- error message when creating expression on crosstab...
- Subscribe to RSS Feed
- Mark Topic as New
- Mark Topic as Read
- Float this Topic for Current User
- Bookmark
- Subscribe
- Mute
- Printer Friendly Page
- Mark as New
- Bookmark
- Subscribe
- Mute
- Subscribe to RSS Feed
- Permalink
- Report Inappropriate Content
error message when creating expression on crosstable
Hello,
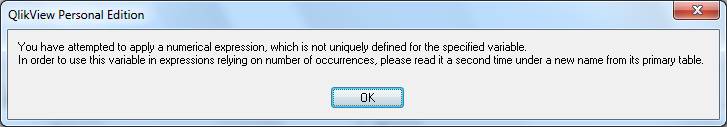
I have the following error message when I add an expression in my graph : "You have attempted to apply a numerical expression, which is not uniquely defined for the specified variable. In order to use this variable in expressions relying on number of occurrences, please read it a second time under a new name from its primary table."
This is what I wish to make:
- Import a crossed table (cf example below, and associated script)
- To create a line chart (sum on all the projects), with in dimension the date
After import data, I create a new chart, select 'line chart', the dimension 'date' and the expression Sum(myData). The error appears if I choose 'Sum' and ' myData ' in the drop-down lists, but there is no error if I write directly the expression. However, it does not generate the expected graph.
What is the good approach ?
Thank you in advance !
Vincent
---------------------------------------------------------------------------------------------------------------------------------
Here are the test data :
| project | 01/01/2012 | 02/01/2012 | 03/01/2012 | 04/01/2012 | 05/01/2012 | 06/01/2012 | 07/01/2012 | 08/01/2012 | 09/01/2012 | 10/01/2012 | 11/01/2012 | 12/01/2012 | 13/01/2012 |
| p1 | 1 | 0 | 0 | 0 | 0 | 0 | 0 | 0 | 0 | 0 | 0 | 0 | 0 |
| p2 | 0 | 0 | 0 | 0 | 0 | 0 | 6 | 0 | 0 | 0 | 0 | 0 | 0 |
| p3 | 0 | 0 | 0 | 0 | 0 | 0 | 5 | 0 | 0 | 0 | 0 | 0 | 0 |
| p4 | 0 | 0 | 0 | 0 | 0 | 0 | 0 | 1 | 0 | 0 | 0 | 0 | 0 |
| p5 | 0 | 0 | 0 | 0 | 0 | 1 | 0 | 0 | 1 | 0 | 4 | 0 | 0 |
| p6 | 0 | 0 | 1 | 1 | 0 | 0 | 0 | 0 | 0 | 0 | 0 | 0 | 0 |
| p7 | 0 | 0 | 0 | 0 | 0 | 1 | 0 | 0 | 1 | 0 | 3 | 0 | 0 |
| p8 | 0 | 0 | 0 | 0 | 0 | 0 | 0 | 0 | 0 | 0 | 0 | 0 | 0 |
| p9 | 0 | 0 | 0 | 0 | 1 | 0 | 0 | 0 | 0 | 0 | 32 | 0 | 0 |
| p10 | 0 | 0 | 1 | 0 | 0 | 5 | 5 | 0 | 1 | 0 | 0 | 0 | 9 |
| p11 | 0 | 0 | 0 | 65 | 0 | 0 | 0 | 0 | 0 | 0 | 0 | 88 | 0 |
| p12 | 0 | 0 | 0 | 0 | 0 | 0 | 0 | 0 | 0 | 5 | 0 | 0 | 0 |
| p13 | 0 | 6 | 6 | 0 | 0 | 0 | 0 | 0 | 0 | 0 | 0 | 0 | 0 |
| p14 | 0 | 0 | 0 | 0 | 0 | 0 | 0 | 0 | 0 | 0 | 0 | 0 | 0 |
| p15 | 0 | 0 | 0 | 0 | 0 | 0 | 0 | 0 | 0 | 0 | 0 | 0 | 0 |
Here is the script generated for the import of the Excel file :
CrossTable(date, myData)
LOAD project,
40909,
40910,
40911,
40912,
40913,
40914,
40915,
40916,
40917,
40918,
40919,
40920,
40921
FROM
D:\Temp\Classeur2.xlsx
(ooxml, embedded labels, table is Feuil1);
PS: I saw that the discussion n°146856 treated with the same subject, but finally has no answer...
PPS : For french search in this forum :), the error message is "Vous avez tenté d'appliquer une expression numérique qui n'est pas définie de façon unique pour la variable concernée. Afin d'utiliser cette variable dans des expressions basées sur le nombre d'occurences, rechargez-la sous un nouveau nom à partir de sa table principale."
Accepted Solutions
- Mark as New
- Bookmark
- Subscribe
- Mute
- Subscribe to RSS Feed
- Permalink
- Report Inappropriate Content
Some actions I noticed :
1) when I use * instead of the explicit columns names in script :
=> crosstable dates are better recognised and data are correct (but when I keep automatic creation script, with column names, data are wrong)
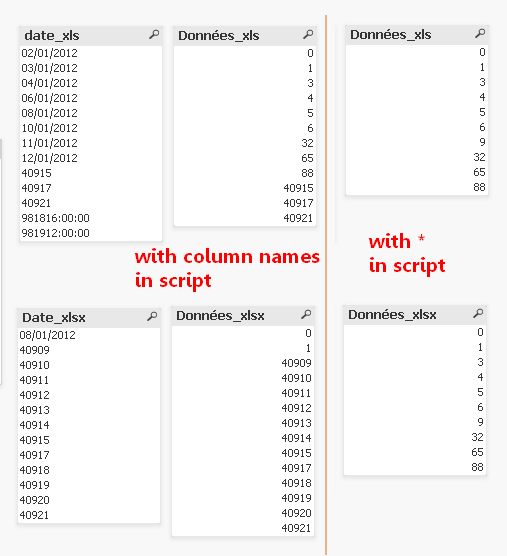
2) with XLSX (or XLSM) files (Excel 2007), date cells are not correctly imported (date is only correct when it is text cell).
=> But in Excel 2003, it's ok with classic date format (not all date formats).
Is it a bug with QlikView ?
I will post a new question...
- Mark as New
- Bookmark
- Subscribe
- Mute
- Subscribe to RSS Feed
- Permalink
- Report Inappropriate Content
hei
attach is an example hope it helps you
- Mark as New
- Bookmark
- Subscribe
- Mute
- Subscribe to RSS Feed
- Permalink
- Report Inappropriate Content
Thanks for your file, but I can't open it, I don't have licence for QlikView, so i can only open my own files...
Can you explain in a few words what you did in this file ?
Thanks !
Vincent
- Mark as New
- Bookmark
- Subscribe
- Mute
- Subscribe to RSS Feed
- Permalink
- Report Inappropriate Content
Hi,
Try to use this code. I am able to create the line chart and it is working fine.
T1:
CrossTable(Date, Data)
LOAD *
FROM
[Classeur2(1).xlsx]
(ooxml, embedded labels, table is Feuil2);
- Mark as New
- Bookmark
- Subscribe
- Mute
- Subscribe to RSS Feed
- Permalink
- Report Inappropriate Content
Sorry, i always have the same problem when i select "Sum" in drop-down lists. And when i copy-past "Sum(Data)" in script window, i have this chart :
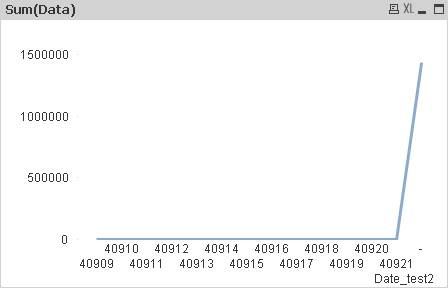
which is incorrect :
- date are not date format
- value max should be 88 and not 1 500 000 !!
I don't understand what happen... 
- Mark as New
- Bookmark
- Subscribe
- Mute
- Subscribe to RSS Feed
- Permalink
- Report Inappropriate Content
Hi,
First Create the cross table. Then again load it resident and change date format to (DD-MM-YYYY) or whatever format you need. The date problem will get solved. The null value is appearing because some how your excel have some data without any date. please check that.
T1:
CrossTable(Date_test, Data)
LOAD *
FROM
[Classeur2(1).xlsx]
(ooxml, embedded labels, table is Feuil2);
T2:
Noconcatenate
Load
Project,
Date(Date_test,'DD-MM-YYYY') as Date_test,
Data
Resident T1;
Drop Table T1;
Hope this will help.
- Mark as New
- Bookmark
- Subscribe
- Mute
- Subscribe to RSS Feed
- Permalink
- Report Inappropriate Content
Hi,
I tried but conversion is not ok. Date are always like '40896' instead of '19/12/2012'.
But when i save the xlsm file in xls (=Excel 2003), it's ok (date at good format, data corrects, graph ok) !
So I think it's a problem of conversion / compatibility with Excel 2007, date are not recognised well and data are wrong.
If anybody have another advice... i take it !
instead, i will try to convert with old Excel, but not very usefull for me...
Vincent
- Mark as New
- Bookmark
- Subscribe
- Mute
- Subscribe to RSS Feed
- Permalink
- Report Inappropriate Content
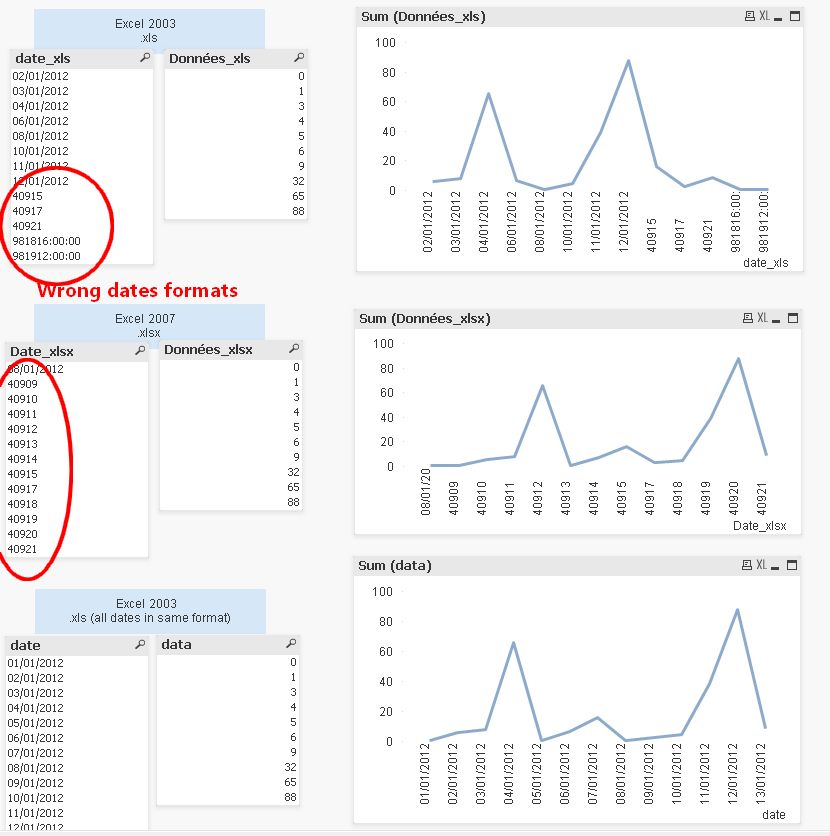
Some actions I noticed :
1) when I use * instead of the explicit columns names in script :
=> crosstable dates are better recognised and data are correct (but when I keep automatic creation script, with column names, data are wrong)
2) with XLSX (or XLSM) files (Excel 2007), date cells are not correctly imported (date is only correct when it is text cell).
=> But in Excel 2003, it's ok with classic date format (not all date formats).
Is it a bug with QlikView ?
I will post a new question...
- Mark as New
- Bookmark
- Subscribe
- Mute
- Subscribe to RSS Feed
- Permalink
- Report Inappropriate Content
This script give me good date with xlsx file (cf post 99797) :
T1:
CrossTable(date, myData)
LOAD *
FROM
D:\Temp\Classeur1.xlsx
(ooxml, embedded labels, table is Feuil1, filters(
Remove(Row, Pos(Top, 17)),
Remove(Col, Pos(Top, 15))
));
T2:
LOAD *,
Date(Num(Evaluate(date))) as "date_ok"
Resident T1;
DROP TABLE T1;