Unlock a world of possibilities! Login now and discover the exclusive benefits awaiting you.
- Qlik Community
- :
- All Forums
- :
- QlikView App Dev
- :
- Key Brands Availability Comparision of LM vs L3M
- Subscribe to RSS Feed
- Mark Topic as New
- Mark Topic as Read
- Float this Topic for Current User
- Bookmark
- Subscribe
- Mute
- Printer Friendly Page
- Mark as New
- Bookmark
- Subscribe
- Mute
- Subscribe to RSS Feed
- Permalink
- Report Inappropriate Content
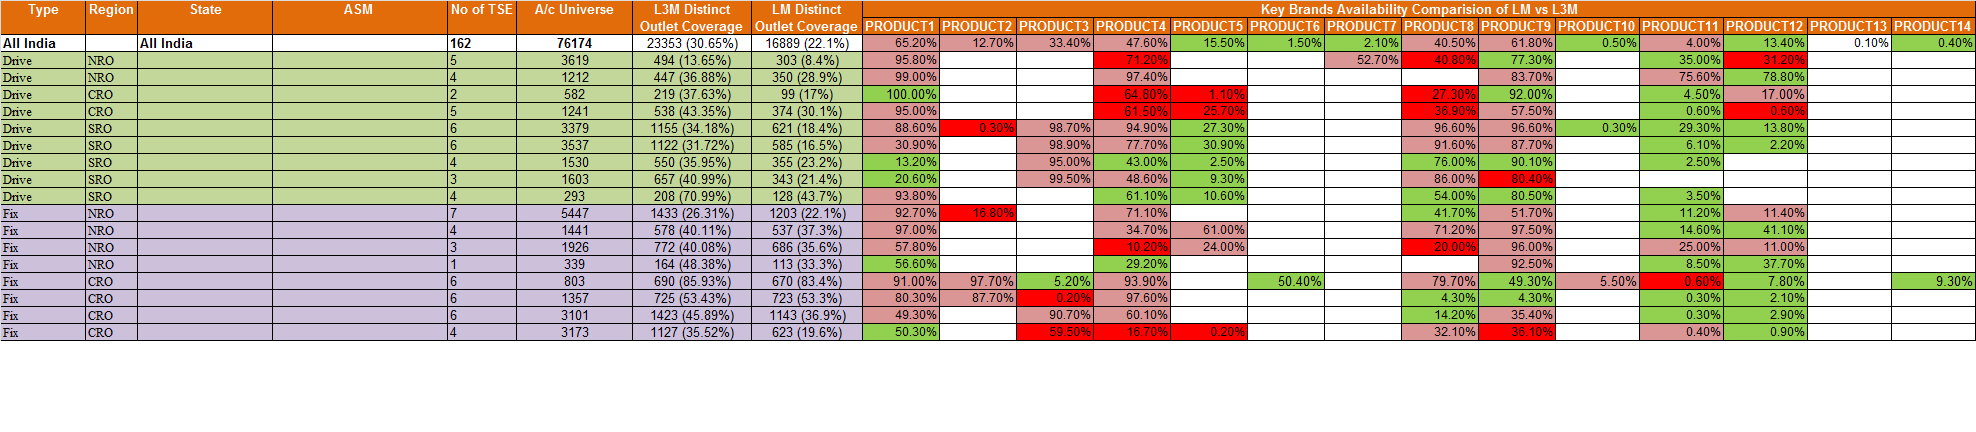
Key Brands Availability Comparision of LM vs L3M
Hello All,
My requirement is to show the ''Key Brands Availability Comparision of LM vs L3M'' i am having different products,this should be shown in pivot table for example like this..
| Key Brands Availability Comparision of LM vs L3M | |||||||||||||
| product1 | product1 | product3 | product4 | product5 | product6 | product7 | product8 | product9 | product10 | product11 | product12 | product13 | product14 |
| 65.20% | 12.70% | 33.40% | 47.60% | 15.50% | 1.50% | 2.10% | 40.50% | 61.80% | 0.50% | 4.00% | 13.40% | 0.10% | 0.40% |
| 95.80% | 71.20% | 52.70% | 40.80% | 77.30% | 35.00% | 31.20% | |||||||
| 99.00% | 97.40% | 83.70% | 75.60% | 78.80% | |||||||||
| 100.00% | 64.80% | 1.10% | 27.30% | 92.00% | 4.50% | 17.00% | |||||||
| 95.00% | 61.50% | 25.70% | 36.90% | 57.50% | 0.60% | 0.60% | |||||||
| 88.60% | 0.30% | 98.70% | 94.90% | 27.30% | 96.60% | 96.60% | 0.30% | 29.30% | 13.80% | ||||
| 30.90% | 98.90% | 77.70% | 30.90% | 91.60% | 87.70% | 6.10% | 2.20% | ||||||
| 13.20% | 95.00% | 43.00% | 2.50% | 76.00% | 90.10% | 2.50% | |||||||
| 20.60% | 99.50% | 48.60% | 9.30% | 86.00% | 80.40% | ||||||||
| 93.80% | 61.10% | 10.60% | 54.00% | 80.50% | 3.50% | ||||||||
| 92.70% | 16.80% | 71.10% | 41.70% | 51.70% | 11.20% | 11.40% | |||||||
| 97.00% | 34.70% | 61.00% | 71.20% | 97.50% | 14.60% | 41.10% | |||||||
| 57.80% | 10.20% | 24.00% | 20.00% | 96.00% | 25.00% | 11.00% | |||||||
| 56.60% | 29.20% | 92.50% | 8.50% | 37.70% | |||||||||
| 91.00% | 97.70% | 5.20% | 93.90% | 50.40% | 79.70% | 49.30% | 5.50% | 0.60% | 7.80% | 9.30% | |||
| 80.30% | 87.70% | 0.20% | 97.60% | 4.30% | 4.30% | 0.30% | 2.10% | ||||||
| 49.30% | 90.70% | 60.10% | 14.20% | 35.40% | 0.30% | 2.90% | |||||||
| 50.30% | 59.50% | 16.70% | 0.20% | 32.10% | 36.10% | 0.40% | 0.90% | ||||||
| 66.60% | 31.80% | 31.00% | 0.80% | 16.30% | 22.80% | 2.20% | 3.30% | ||||||
| 89.50% | 82.50% | 59.70% | 85.30% | 0.70% | 63.70% | 63.90% | 0.40% | 5.60% | |||||
can any one know how to get this type in pivot table.i am writing the expression but it is not getting the correct value.
Regards,
bar
- Mark as New
- Bookmark
- Subscribe
- Mute
- Subscribe to RSS Feed
- Permalink
- Report Inappropriate Content
Ok - that's what you want to get to. What structure is your data at the moment? Tables, fields etc?
- Mark as New
- Bookmark
- Subscribe
- Mute
- Subscribe to RSS Feed
- Permalink
- Report Inappropriate Content
Hi Jason,
Thanks for ur Reply, I Mensioned in the column i.e.,Product1,product2,etc...these are all the fields in one table only.
You have any idea for writing the expression for these out put.
Regards,
bar.
- Mark as New
- Bookmark
- Subscribe
- Mute
- Subscribe to RSS Feed
- Permalink
- Report Inappropriate Content
But what about your LM and L3M measures? Do you have 2 columns for each product or 2 rows? Can post some sample data?
- Mark as New
- Bookmark
- Subscribe
- Mute
- Subscribe to RSS Feed
- Permalink
- Report Inappropriate Content
Hi Jason,
I want to show like this with expressions and dimensions,product1,product2,etc...these are the fields in only one table.for ex. LM= March and L3M= Feb,Jan and Dec
Regards,
bar
- Mark as New
- Bookmark
- Subscribe
- Mute
- Subscribe to RSS Feed
- Permalink
- Report Inappropriate Content
Bar,
I can see what you want it to look like but please tell me whatthe data looks like now! Please post some sample source data and your data model (Ctrl+T) from QlikView.
Cheers,
Jason