Unlock a world of possibilities! Login now and discover the exclusive benefits awaiting you.
- Qlik Community
- :
- All Forums
- :
- QlikView App Dev
- :
- Re: Dynamic column name on selection of parmeter
- Subscribe to RSS Feed
- Mark Topic as New
- Mark Topic as Read
- Float this Topic for Current User
- Bookmark
- Subscribe
- Mute
- Printer Friendly Page
- Mark as New
- Bookmark
- Subscribe
- Mute
- Subscribe to RSS Feed
- Permalink
- Report Inappropriate Content
Dynamic column name on selection of parmeter
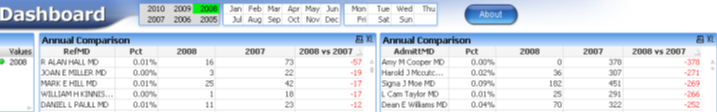
if you look to above snap; then you will see on selection of year the below chart column is changed
e.g. on selection of 2008.
Regards
Andy
Accepted Solutions
- Mark as New
- Bookmark
- Subscribe
- Mute
- Subscribe to RSS Feed
- Permalink
- Report Inappropriate Content
Andy, since you seem to have access to the application, it is most easy to just open the properties and learn how things are done in a working application. There are probably two issues here: the dynamic change of the column header and the limitation of the calculation of the column values depending on the selected year.
Regarding the first issue, the column name or label can be defined via an expression, for example if Year is your year field name,
=max(Year)
will show the (max) selected year as label or column header.
=max(Year)-1
will show the previous Year, and
=max(Year) & ' vs. ' & max(Year)-1
e.g. '2012 vs. 2011'.
You can limit the calculation of the values to selected years using set analysis, like:
=sum({<Year = {$(=max(Year))}>} Sales)
and
=sum({<Year = {$(=max(Year)-1)}>} Sales)
Hope this helps,
Stefan
- Mark as New
- Bookmark
- Subscribe
- Mute
- Subscribe to RSS Feed
- Permalink
- Report Inappropriate Content
Andy,
Since you already set the status of this post to 'Assumed answered' and I can't see a question anywhere, I think you want to show a possible solution to a problem you solved.
That's fine, but please elaborate a bit more what your requirements were and what you did, step by step, so someone else having this requirement too can resuse what you've done.
Thanks,
Stefan
- Mark as New
- Bookmark
- Subscribe
- Mute
- Subscribe to RSS Feed
- Permalink
- Report Inappropriate Content
Hello Stefan,
Sorry my mistake i didn't mention the issue which i am facing. So here is the question ;
on selection of year , i want my column name take that year which i selected from the list and next column with
1 less to it and 3rd column hold the difference of both column.
C1 C2 C3
RefMD 2008 2007 2008 Vs 2007
Hope this clear my question.
Regards
Andy
- Mark as New
- Bookmark
- Subscribe
- Mute
- Subscribe to RSS Feed
- Permalink
- Report Inappropriate Content
Andy, since you seem to have access to the application, it is most easy to just open the properties and learn how things are done in a working application. There are probably two issues here: the dynamic change of the column header and the limitation of the calculation of the column values depending on the selected year.
Regarding the first issue, the column name or label can be defined via an expression, for example if Year is your year field name,
=max(Year)
will show the (max) selected year as label or column header.
=max(Year)-1
will show the previous Year, and
=max(Year) & ' vs. ' & max(Year)-1
e.g. '2012 vs. 2011'.
You can limit the calculation of the values to selected years using set analysis, like:
=sum({<Year = {$(=max(Year))}>} Sales)
and
=sum({<Year = {$(=max(Year)-1)}>} Sales)
Hope this helps,
Stefan
- Mark as New
- Bookmark
- Subscribe
- Mute
- Subscribe to RSS Feed
- Permalink
- Report Inappropriate Content
Thnx Stefan