Unlock a world of possibilities! Login now and discover the exclusive benefits awaiting you.
- Qlik Community
- :
- All Forums
- :
- QlikView App Dev
- :
- Re: Set Analysis - Expressions and Dimensions
- Subscribe to RSS Feed
- Mark Topic as New
- Mark Topic as Read
- Float this Topic for Current User
- Bookmark
- Subscribe
- Mute
- Printer Friendly Page
- Mark as New
- Bookmark
- Subscribe
- Mute
- Subscribe to RSS Feed
- Permalink
- Report Inappropriate Content
Set Analysis - Expressions and Dimensions
Hi
I have the following QV10 set analysis expression :
=sum( {$< [Reporting Code 1] = {CSE},
[Fiscal Year] = {"<=$(=max([Fiscal Year]))"} > } [Amount])
The single dimension of the chart is also [Fiscal Year].
Unfortunately when I use this expression, and select 2010, all of the years of the above set are displayed in the chart. I would like to select 2010 and see the sum of the amount for all years up to and including the selected year. As a stand alone expression this works fine.
When I use it in the [Fiscal Year] dimensioned chart I now see 3 columns - for 2008, 2009 and 2010. For some reason the presence of the 3 years in the modified set is becoming visible in the chart even although only one year has been selected.
Any help with this would be mcuh appreciated.
Regards
Andrew.
- Mark as New
- Bookmark
- Subscribe
- Mute
- Subscribe to RSS Feed
- Permalink
- Report Inappropriate Content
Hi,
Your expression displays all the years less than and equal to the Maximum Year
=sum( {$< [Reporting Code 1] = {CSE},
[Fiscal Year] = {"<=$(=max([Fiscal Year]))"} > } [Amount])
Suppose you have 2008, 2009 and 2010 Years in the list box. Now your expression displays all the three years because max year is 2010 so 2008, 2009 and 2010 are displayed.
Suppose you select 2009 then your expression displays 2008 and 2009.
If you select 2010, now the max year is 2010 and displays all the years less than 2010. It won't display 2010 alone. Your expression explicitly telling that display all years less than 2010.
I think you understand my explanation.
Hope this helps you.
Regards,
Jagan.
- Mark as New
- Bookmark
- Subscribe
- Mute
- Subscribe to RSS Feed
- Permalink
- Report Inappropriate Content
Hi Jagan,
I have a similar problem.
What expression would we need to dispay just the one column (eg 2010), but have the calculation accumulate the Amount from every year up and including 2010?
ie. The result should equal 2008 + 2009 + 2010
Regards,
Michael
- Mark as New
- Bookmark
- Subscribe
- Mute
- Subscribe to RSS Feed
- Permalink
- Report Inappropriate Content
Hi,
Use Variable .Max(Year) & expressions is SUM({<GYEAR={"<=$(=MAX([GYEAR]))"}>} SALES).
Pls refer my attachment file.
Regards,
Muni
- Mark as New
- Bookmark
- Subscribe
- Mute
- Subscribe to RSS Feed
- Permalink
- Report Inappropriate Content
Actually, I did not explain my problem very well because it was complicated by other dimensions.
I am actually accumulating values across months in a pivot table. Sometimes multiple months will be visible, but the accumulation must still work. It looks like the image I have attached.
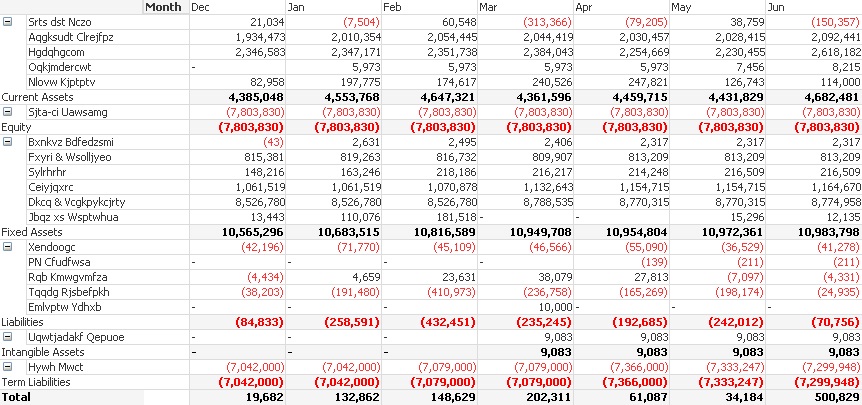
Your example no longer works if 2009 and 2010 are both displayed, because it will only display the value for each year.
I have solved my problem by calculating an accumulation column in the script as per this post: http://community.qlik.com/thread/50551
Thanks for your help.
Michael