Unlock a world of possibilities! Login now and discover the exclusive benefits awaiting you.
- Qlik Community
- :
- All Forums
- :
- QlikView App Dev
- :
- Re: Duration greater than 24 hours
- Subscribe to RSS Feed
- Mark Topic as New
- Mark Topic as Read
- Float this Topic for Current User
- Bookmark
- Subscribe
- Mute
- Printer Friendly Page
- Mark as New
- Bookmark
- Subscribe
- Mute
- Subscribe to RSS Feed
- Permalink
- Report Inappropriate Content
Duration greater than 24 hours
I have three fields: StartTime, EndTime, and Duration. They are all in hh:mm:ss format. But when I use the expressions sum(Duration), sum(hour(duration)), or even interval(sum([Duration]),'hh:mm'), it isn't adding correctly. My total duration should be about 80 hours, and it only shows 8. Suggestions?
Accepted Solutions
- Mark as New
- Bookmark
- Subscribe
- Mute
- Subscribe to RSS Feed
- Permalink
- Report Inappropriate Content
It seems that you format your expression as date not as interval (or that the format of duration field is a date format?).
Try setting an explicite interval format in number tab of your chart.
Attached is my sample file.
Hope this helps,
Stefan
- Mark as New
- Bookmark
- Subscribe
- Mute
- Subscribe to RSS Feed
- Permalink
- Report Inappropriate Content
Using interval function should be correct.
What does =sum(Duration) show? A number a little larger than 3?
- Mark as New
- Bookmark
- Subscribe
- Mute
- Subscribe to RSS Feed
- Permalink
- Report Inappropriate Content
The total sum shows 12320:14:30, which equals the "sum" in Excel. I have attached the spreadsheet with start time, end time, and duration, because I think the problem may be from the Duration field in Excel?
- Mark as New
- Bookmark
- Subscribe
- Mute
- Subscribe to RSS Feed
- Permalink
- Report Inappropriate Content
Why do you think your sum of durations should be some 80 hours instead 12320 then?
- Mark as New
- Bookmark
- Subscribe
- Mute
- Subscribe to RSS Feed
- Permalink
- Report Inappropriate Content
It shouldn't, sorry for the confusion. The y-axis on my graph shows the following (even though it is in hh:mm format):
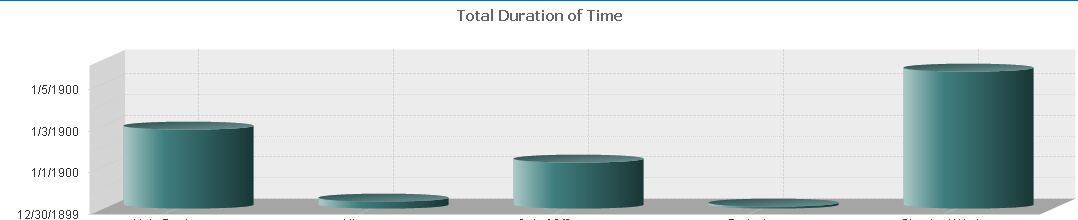
I guess this is the real problem.
- Mark as New
- Bookmark
- Subscribe
- Mute
- Subscribe to RSS Feed
- Permalink
- Report Inappropriate Content
What's the problem then? The format of the data on the y-axis?
- Mark as New
- Bookmark
- Subscribe
- Mute
- Subscribe to RSS Feed
- Permalink
- Report Inappropriate Content
Yes, and in the straight table. The grand total of Duration with no filters whatsoever is "8:14", which is not right at all.
- Mark as New
- Bookmark
- Subscribe
- Mute
- Subscribe to RSS Feed
- Permalink
- Report Inappropriate Content
It seems that you format your expression as date not as interval (or that the format of duration field is a date format?).
Try setting an explicite interval format in number tab of your chart.
Attached is my sample file.
Hope this helps,
Stefan
- Mark as New
- Bookmark
- Subscribe
- Mute
- Subscribe to RSS Feed
- Permalink
- Report Inappropriate Content
That solved the problem - it was set as Time not Interval. Thank you, Stefan!