Unlock a world of possibilities! Login now and discover the exclusive benefits awaiting you.
Announcements
Qlik Connect 2025: 3 days of full immersion in data, analytics, and AI. May 13-15 | Orlando, FL:
Learn More
- Qlik Community
- :
- All Forums
- :
- QlikView App Dev
- :
- Re: How do I format the number format of a dimensi...
Options
- Subscribe to RSS Feed
- Mark Topic as New
- Mark Topic as Read
- Float this Topic for Current User
- Bookmark
- Subscribe
- Mute
- Printer Friendly Page
Turn on suggestions
Auto-suggest helps you quickly narrow down your search results by suggesting possible matches as you type.
Showing results for
Anonymous
Not applicable
2012-08-15
10:01 AM
- Mark as New
- Bookmark
- Subscribe
- Mute
- Subscribe to RSS Feed
- Permalink
- Report Inappropriate Content
How do I format the number format of a dimension (not expression)?
Hi
This is a really simple question that I'm hoping has a really simple answer. Any help would be greatly appreciated.
I'm plotting a histogram of returns using Floor(Return,0.01) as my dimension and Count(Return) as my expression. It works perfectly, but I would like the x-axis formatted as %. I can't find anywhere to do this.
Thanks.
Joao.
8,607 Views
1 Solution
Accepted Solutions
Partner - Master II
2012-08-15
10:02 AM
- Mark as New
- Bookmark
- Subscribe
- Mute
- Subscribe to RSS Feed
- Permalink
- Report Inappropriate Content
1,695 Views
5 Replies
Anonymous
Not applicable
2012-08-15
10:01 AM
Author
- Mark as New
- Bookmark
- Subscribe
- Mute
- Subscribe to RSS Feed
- Permalink
- Report Inappropriate Content
in number select percentage
1,695 Views
Partner - Master II
2012-08-15
10:02 AM
- Mark as New
- Bookmark
- Subscribe
- Mute
- Subscribe to RSS Feed
- Permalink
- Report Inappropriate Content
num(Floor(Return,0.01), '# ##0.00%')
maybe this helps
1,696 Views
Anonymous
Not applicable
2012-08-15
10:05 AM
Author
- Mark as New
- Bookmark
- Subscribe
- Mute
- Subscribe to RSS Feed
- Permalink
- Report Inappropriate Content
The dimension does not appear in Number.
Joao
Sent from my iPad
1,695 Views
Not applicable
2012-08-15
10:17 AM
Author
- Mark as New
- Bookmark
- Subscribe
- Mute
- Subscribe to RSS Feed
- Permalink
- Report Inappropriate Content
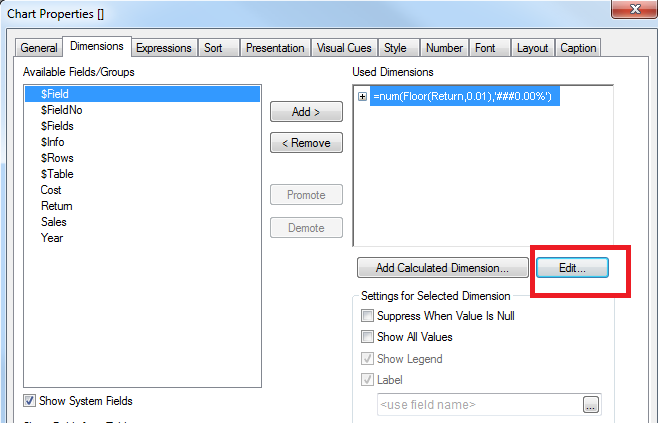
Go to Chart properties --> Dimensions --> Add 'Return' as Dimension and then Edit to make it
=num(Floor(Return,0.01),'###0.00%')
Regards
Raj
1,695 Views
Anonymous
Not applicable
2012-08-15
11:10 AM
Author
- Mark as New
- Bookmark
- Subscribe
- Mute
- Subscribe to RSS Feed
- Permalink
- Report Inappropriate Content
1,695 Views