Unlock a world of possibilities! Login now and discover the exclusive benefits awaiting you.
- Qlik Community
- :
- All Forums
- :
- QlikView App Dev
- :
- Re: Can't make chart for debit and credit
- Subscribe to RSS Feed
- Mark Topic as New
- Mark Topic as Read
- Float this Topic for Current User
- Bookmark
- Subscribe
- Mute
- Printer Friendly Page
- Mark as New
- Bookmark
- Subscribe
- Mute
- Subscribe to RSS Feed
- Permalink
- Report Inappropriate Content
Can't make chart for debit and credit
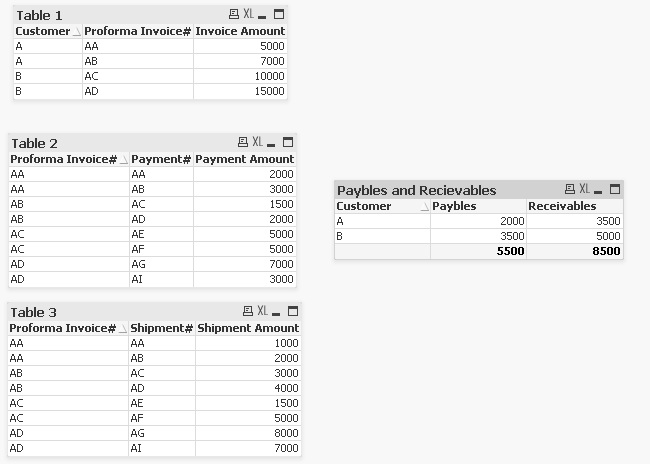
I have three tables with numbers and amounts of invoices, payments and shipments. I can't understand, how get right result in the Chart? Should I prepare something in Script. I point yellow Chart that I need.
Thanks for help.
- « Previous Replies
-
- 1
- 2
- Next Replies »
- Mark as New
- Bookmark
- Subscribe
- Mute
- Subscribe to RSS Feed
- Permalink
- Report Inappropriate Content
Change the expression function 'Min' to 'MinString' and 'Max' to 'MaxString'.
It wil work.
- Mark as New
- Bookmark
- Subscribe
- Mute
- Subscribe to RSS Feed
- Permalink
- Report Inappropriate Content
If I add one more PI# with customer A in table 1, it doesn't work. MaxString and MinString count 2 PI# only for each Customer.
Customer Proforma Invoice# Invoice Amount
A AA 5000
A AB 7000
B AC 10000
B AD 15000
A AE 5000
- Mark as New
- Bookmark
- Subscribe
- Mute
- Subscribe to RSS Feed
- Permalink
- Report Inappropriate Content
It would be easy if you could provide all your requirement at the same time.
For the current requirement you can use the below expresion:
Payables:
=Sum(If(Aggr(Sum([Payment Amount]),[Proforma Invoice#])> Aggr(Sum([Shipment Amount]),[Proforma Invoice#])
, Aggr(Sum([Payment Amount]),[Proforma Invoice#])-Aggr(Sum([Shipment Amount]),[Proforma Invoice#]),0))
Recivables:
=Sum(If(Aggr(Sum([Shipment Amount]),[Proforma Invoice#])> Aggr(Sum([Payment Amount]),[Proforma Invoice#])
, Aggr(Sum([Shipment Amount]),[Proforma Invoice#])-Aggr(Sum([Payment Amount]),[Proforma Invoice#]),0))
Hope this helps.
- Mark as New
- Bookmark
- Subscribe
- Mute
- Subscribe to RSS Feed
- Permalink
- Report Inappropriate Content
Thank for your help. I will try to give my questions with right requirements.
- « Previous Replies
-
- 1
- 2
- Next Replies »