Unlock a world of possibilities! Login now and discover the exclusive benefits awaiting you.
- Qlik Community
- :
- All Forums
- :
- QlikView
- :
- Re: Restrict a chart of type pivot table to top 10...
- Subscribe to RSS Feed
- Mark Topic as New
- Mark Topic as Read
- Float this Topic for Current User
- Bookmark
- Subscribe
- Mute
- Printer Friendly Page
- Mark as New
- Bookmark
- Subscribe
- Mute
- Subscribe to RSS Feed
- Permalink
- Report Inappropriate Content
Restrict a chart of type pivot table to top 10 rows?
How can I restrict or display a chart of type pivot table to top 10 rows? Thanks
- Mark as New
- Bookmark
- Subscribe
- Mute
- Subscribe to RSS Feed
- Permalink
- Report Inappropriate Content
Hi Bimalhaz,
You can get idea from the following link
http://community.qlik.com/message/256499#256499
Regards,
Tom
- Mark as New
- Bookmark
- Subscribe
- Mute
- Subscribe to RSS Feed
- Permalink
- Report Inappropriate Content
Hi,
Hope attached file helps you.
Regards,
Jagan.
- Mark as New
- Bookmark
- Subscribe
- Mute
- Subscribe to RSS Feed
- Permalink
- Report Inappropriate Content
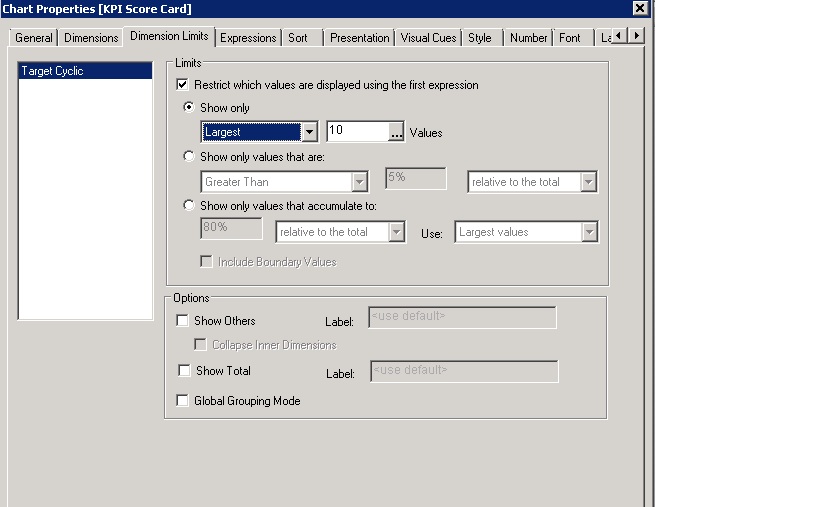
Dear its qlikview 11 defualt property named >> dimension limits
or it aslo covered in Chart properties >> presentations>>follow the attachments for both examples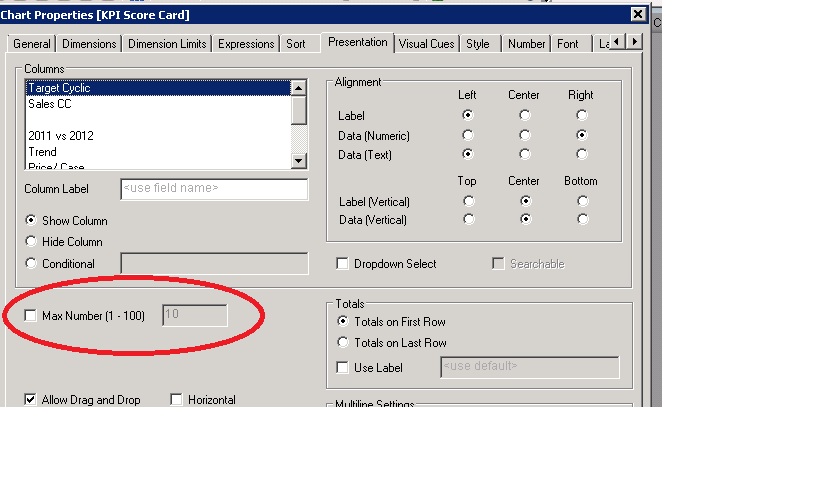
- Mark as New
- Bookmark
- Subscribe
- Mute
- Subscribe to RSS Feed
- Permalink
- Report Inappropriate Content
Good evening friends
I am facing the same problem and I need your help
I try to display the first 10 sales per country in a Pivot table

so I added this expression in dimensions

and as a result I have

as you can see for 2010 it gives a result USA-> France-> germany and the logical order is USA-> France-> UK
why?
Thank you for your answers
- Mark as New
- Bookmark
- Subscribe
- Mute
- Subscribe to RSS Feed
- Permalink
- Report Inappropriate Content
you should use Year in your aggr exp
aggr(rank(sales),year,Country)