Unlock a world of possibilities! Login now and discover the exclusive benefits awaiting you.
- Qlik Community
- :
- All Forums
- :
- QlikView App Dev
- :
- Re: I have a chart issue!
- Subscribe to RSS Feed
- Mark Topic as New
- Mark Topic as Read
- Float this Topic for Current User
- Bookmark
- Subscribe
- Mute
- Printer Friendly Page
- Mark as New
- Bookmark
- Subscribe
- Mute
- Subscribe to RSS Feed
- Permalink
- Report Inappropriate Content
I have a chart issue!
Afternoon all,
I've attached the Gantt chart I'm trying to create hoping that someone out there will be able to help me solve some issues I'm having!
My Gantt chart will currently only show the data when the style is grouped, I need to be able to show it stacked so each project has the different phases along the same line.
Can someone out there let me know if this is possible please?
- « Previous Replies
-
- 1
- 2
- Next Replies »
Accepted Solutions
- Mark as New
- Bookmark
- Subscribe
- Mute
- Subscribe to RSS Feed
- Permalink
- Report Inappropriate Content
Oh WOW...why on earth can't I see that on my version?!!!!
I'm running QV10, surely that can't be why?!
Thanks for your help Jonathan
- Mark as New
- Bookmark
- Subscribe
- Mute
- Subscribe to RSS Feed
- Permalink
- Report Inappropriate Content
**BUMP**
- Mark as New
- Bookmark
- Subscribe
- Mute
- Subscribe to RSS Feed
- Permalink
- Report Inappropriate Content
I represent gantt charts using a horizontal bar chart, with date as the primary dimension, project as the secondrary dimension and number of days as the expression.
Each task then the start date set as it's bar offset, which you can get to by expanding the ( + ) symbol alongside the expression.
Jonathan
- Mark as New
- Bookmark
- Subscribe
- Mute
- Subscribe to RSS Feed
- Permalink
- Report Inappropriate Content
Hi Jonathan,
The issue I have though is I don't want the different phases to be offset from one another, I need them to show on the same line.
Whenever I try changing the style to stacked everything vanishes.
- Mark as New
- Bookmark
- Subscribe
- Mute
- Subscribe to RSS Feed
- Permalink
- Report Inappropriate Content
Could try using a pivot table instead, with the date dimension running along the top, and the expression being an image that displays different coloured blocks for each phase when the day is active, or blank if no activity that day.
Haven't done it before but have been thinking about it.
- Mark as New
- Bookmark
- Subscribe
- Mute
- Subscribe to RSS Feed
- Permalink
- Report Inappropriate Content
This is the latest version I have, the chart that is currently blank is the one I'm trying to turn into a stacked Gantt.
I can't help but feel I'm really close to achieving this.
- Mark as New
- Bookmark
- Subscribe
- Mute
- Subscribe to RSS Feed
- Permalink
- Report Inappropriate Content
Soorry, I'd not looked at your example (I tend to check this group when I'm doing a reload so can't open other files at that point). Seems you've got the offset working, and your stacked chart looks good too.
Can't see which of the 3 charts in your example are 'blank' though. Is it CH02, 06 or 07 ?
- Mark as New
- Bookmark
- Subscribe
- Mute
- Subscribe to RSS Feed
- Permalink
- Report Inappropriate Content
It's CH07 that is completely blank for me, all I can see are the labels for both axes and the legend box. I can't actually see anything in the main part of the graph...can you see data??
- Mark as New
- Bookmark
- Subscribe
- Mute
- Subscribe to RSS Feed
- Permalink
- Report Inappropriate Content
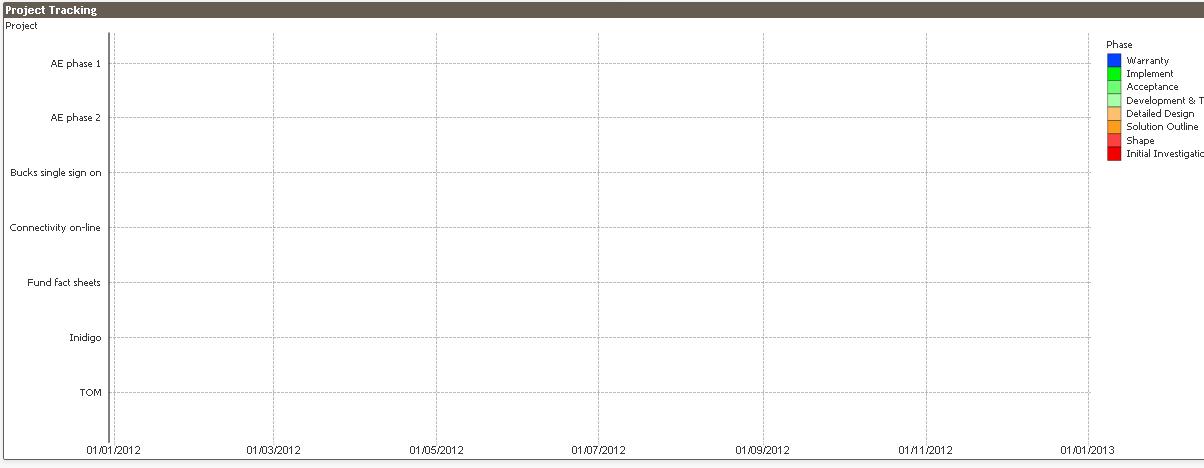
Here's a screenprint of what I can see!!
- Mark as New
- Bookmark
- Subscribe
- Mute
- Subscribe to RSS Feed
- Permalink
- Report Inappropriate Content
Looks fine by me..... running Desktop v11.00.11282.0 SR1 (64bit)

- « Previous Replies
-
- 1
- 2
- Next Replies »