Unlock a world of possibilities! Login now and discover the exclusive benefits awaiting you.
- Qlik Community
- :
- All Forums
- :
- QlikView App Dev
- :
- Re: How To Achive This Layout Using Pivot Table?
- Subscribe to RSS Feed
- Mark Topic as New
- Mark Topic as Read
- Float this Topic for Current User
- Bookmark
- Subscribe
- Mute
- Printer Friendly Page
- Mark as New
- Bookmark
- Subscribe
- Mute
- Subscribe to RSS Feed
- Permalink
- Report Inappropriate Content
How To Achive This Layout Using Pivot Table (or Straight Table)?
Hi,
I have a pivot table that shows sales_number and % of sales and so on. How can I group sales_number and % of sales in a pivot table such that they have a common label 'Sales'?
Sample image attached.
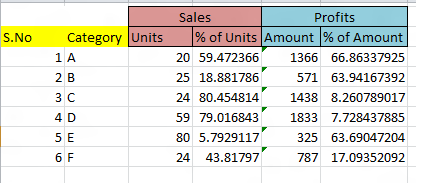
How can I achieve this type of layout for a pivot table in QlikView?
Regards & Thanks,
-Khaled
- Mark as New
- Bookmark
- Subscribe
- Mute
- Subscribe to RSS Feed
- Permalink
- Report Inappropriate Content
No, that's not possible in a pivot table. The expression columns will be shown for all values of a dimension pivoted to columns. And the labels of the expression will be the same for all values too.
talk is cheap, supply exceeds demand
- Mark as New
- Bookmark
- Subscribe
- Mute
- Subscribe to RSS Feed
- Permalink
- Report Inappropriate Content
Hello Gysbert,
Thank you for your response.
Is it possible to achieve the same result in a straight table instead?
Regards,
-Khaled
- Mark as New
- Bookmark
- Subscribe
- Mute
- Subscribe to RSS Feed
- Permalink
- Report Inappropriate Content
Not quite. It's not possible to create a grouped header. What you can do is something like this:

I've set the Header Height to 3 lines and inserted some chr(10) line breaks between Sales and Units.
Or you can fake it with textboxes. See attached qvw.
talk is cheap, supply exceeds demand
- Mark as New
- Bookmark
- Subscribe
- Mute
- Subscribe to RSS Feed
- Permalink
- Report Inappropriate Content
Another way is to create two Pivot tables One having same dimensions with Sales as expression and another same dimension with Profit as expression then have one Layout as top and another as bottom.
Place them in such a manner that the dimensions of the bottom Pivot will be hidden by the layout of the top Pivot.
Only the expressions be visible.
This may not be a best practice but it could be a work around as long as you have the same dimensions to be used.