Unlock a world of possibilities! Login now and discover the exclusive benefits awaiting you.
- Qlik Community
- :
- All Forums
- :
- QlikView App Dev
- :
- Re: Comparative Analysis with (previous month data...
- Subscribe to RSS Feed
- Mark Topic as New
- Mark Topic as Read
- Float this Topic for Current User
- Bookmark
- Subscribe
- Mute
- Printer Friendly Page
- Mark as New
- Bookmark
- Subscribe
- Mute
- Subscribe to RSS Feed
- Permalink
- Report Inappropriate Content
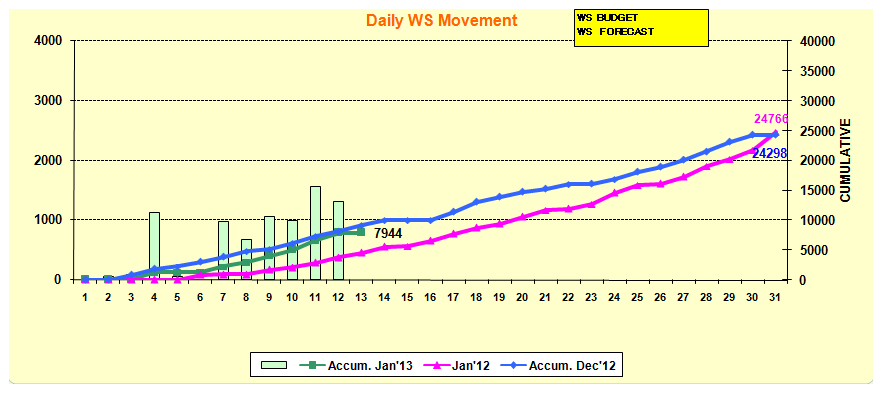
Comparative Analysis with (previous month data)
Hi All,
I want to creat a report on comparison of : -
1)current year month(2013-Jan) - sum( {$<year = {$(=Max(year))}>} Wholesale.TOTAL_QTY)
2) previous year month(2012-Jan) - sum( {$<year = {$(=Max(year)-1)}>} Wholesale.TOTAL_QTY)
3) current year month -1 (2012-Dec),
I done with first 2 points by set analysis with this formula but what set analysis i hv to use to create a graph for 3 point.
Please refer the below image for reference, i have to create such chart in QV.
If possible reply soon, its urgent.
Thanks & Regards
Suresh
- Mark as New
- Bookmark
- Subscribe
- Mute
- Subscribe to RSS Feed
- Permalink
- Report Inappropriate Content
Hi
Try this
Last year Month Sales: (previous year month)
=Sum({<CalendarYear=, MonthName=,OrdDate={'>=$(=MonthStart(Max(OrdDate), -12))<=$(=MonthEnd(Max(OrdDate), -12))'}>} Total_Qty)
For Current Month Sales:
=sum({<CalendarYear={$(=max(CalendarYear))},MonthName={$(=Month(Max(OrdDate)))}>} Total_Qty)
For Last Month Sales:
=sum({<CalendarYear={$(=max(CalendarYear))},MonthName={$(=month(addmonths((max(OrdDate)),-1)))}>}Total_Qty)
Regards,
Nirav Bhimani
- Mark as New
- Bookmark
- Subscribe
- Mute
- Subscribe to RSS Feed
- Permalink
- Report Inappropriate Content
HI ,
For the third:
i think that you need to do for srt_analyses :
{$<year = {$(=Max(year)), Month=(Month(todat()-1))}>}
- Mark as New
- Bookmark
- Subscribe
- Mute
- Subscribe to RSS Feed
- Permalink
- Report Inappropriate Content
Hi Nirav Bhimani,
Can you share me the QV application where you used these expressions??
- Mark as New
- Bookmark
- Subscribe
- Mute
- Subscribe to RSS Feed
- Permalink
- Report Inappropriate Content
HI,
PFA
Hope this will help you.
Regards,
Nirav Bhimani
- Mark as New
- Bookmark
- Subscribe
- Mute
- Subscribe to RSS Feed
- Permalink
- Report Inappropriate Content
1) For Current Year, Current Month:
=sum({<CalendarYear={$(=max(CalendarYear))},CalendarMonth={$(=Month(Max(Date)))}>} ReceiptAmount)
2) For Same Month of Previous Year:
=sum({<CalendarYear={$(=max(CalendarYear)-1)}>},MonthNumber={"<=$(=max({<Year={$(=max(Year))}>} MonthNumber))"}>}} ReceiptAmount)
3) For Prev. Month:
sum({<CalendarYear={$(=max(CalendarYear))},CalendarMonth={$(=Month(Max(Date)-31))}>} ReceiptAmount)
Hope this works for you . . . 