Unlock a world of possibilities! Login now and discover the exclusive benefits awaiting you.
- Qlik Community
- :
- All Forums
- :
- QlikView App Dev
- :
- Re: Vetical and Horizontal viewing
- Subscribe to RSS Feed
- Mark Topic as New
- Mark Topic as Read
- Float this Topic for Current User
- Bookmark
- Subscribe
- Mute
- Printer Friendly Page
- Mark as New
- Bookmark
- Subscribe
- Mute
- Subscribe to RSS Feed
- Permalink
- Report Inappropriate Content
Vetical and Horizontal viewing
Let One dimesion's members be listed vertically across the members of the other one dimesion's members which take place horizontally. How can we create like that tabular report?
Is this "slicing" ?
- « Previous Replies
-
- 1
- 2
- Next Replies »
- Mark as New
- Bookmark
- Subscribe
- Mute
- Subscribe to RSS Feed
- Permalink
- Report Inappropriate Content
Hi,
You can try using Pivot table Chart for this. Go to Chart Properties - General Tab and select Pivot Table as the chart type. You can click and drag dimensions to arrange horizontally or vertically.
Here's a sample app for the same.
Hope it helps.
Regards,
-Khaled.
- Mark as New
- Bookmark
- Subscribe
- Mute
- Subscribe to RSS Feed
- Permalink
- Report Inappropriate Content
Thanks Khaled but I know using pivot table: it has one dimension as vertical and the other dimensions as horizontally. But this is not what I am looking for. I am looking for a way that I can describe one dimesion as vertically (sales like below) but I also can describe the members of only one dimesion (months like below) as horizontally. Like that:
sales Jan Feb Mar Apr May .... .... ....
Pencils xx xx xx xx xx
Books xx xx xx xx xx
..
..
...
- Mark as New
- Bookmark
- Subscribe
- Mute
- Subscribe to RSS Feed
- Permalink
- Report Inappropriate Content
if pencils and books are sales, in pivot table choose both sales and monthname as dimension
and then write as expression Count(Sales)
- Mark as New
- Bookmark
- Subscribe
- Mute
- Subscribe to RSS Feed
- Permalink
- Report Inappropriate Content
if you have the imported table of data please put it to show u a qvw file for it 
- Mark as New
- Bookmark
- Subscribe
- Mute
- Subscribe to RSS Feed
- Permalink
- Report Inappropriate Content
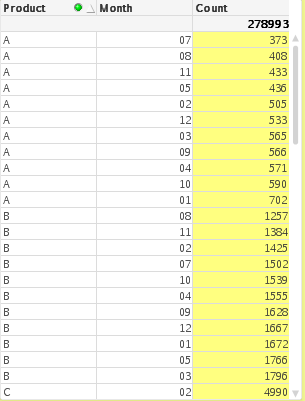
Here it is. But I want that Months take place horizontrally not vertically like below.
- Mark as New
- Bookmark
- Subscribe
- Mute
- Subscribe to RSS Feed
- Permalink
- Report Inappropriate Content
attached is an example
- Mark as New
- Bookmark
- Subscribe
- Mute
- Subscribe to RSS Feed
- Permalink
- Report Inappropriate Content
Bilalebald, can you give it as a screenshot (I cannot open your qlikview apps because of my personal licence.
- Mark as New
- Bookmark
- Subscribe
- Mute
- Subscribe to RSS Feed
- Permalink
- Report Inappropriate Content
Hi,
You can transpose, promote dimensions but cannot change the alignment of rows to columns as such. Please check the attachment to see if it helps.
Regards,
-Khaled.
- Mark as New
- Bookmark
- Subscribe
- Mute
- Subscribe to RSS Feed
- Permalink
- Report Inappropriate Content
1) choose your dimensions : Product and month
2)expression : Count(Product)
3)drag product to the column position
hope this help
- « Previous Replies
-
- 1
- 2
- Next Replies »