Unlock a world of possibilities! Login now and discover the exclusive benefits awaiting you.
- Qlik Community
- :
- All Forums
- :
- QlikView App Dev
- :
- Re: yoy analysis
- Subscribe to RSS Feed
- Mark Topic as New
- Mark Topic as Read
- Float this Topic for Current User
- Bookmark
- Subscribe
- Mute
- Printer Friendly Page
- Mark as New
- Bookmark
- Subscribe
- Mute
- Subscribe to RSS Feed
- Permalink
- Report Inappropriate Content
yoy analysis
Dear Friends,
I have a Following issue
I have ytd amount for 10 yrs
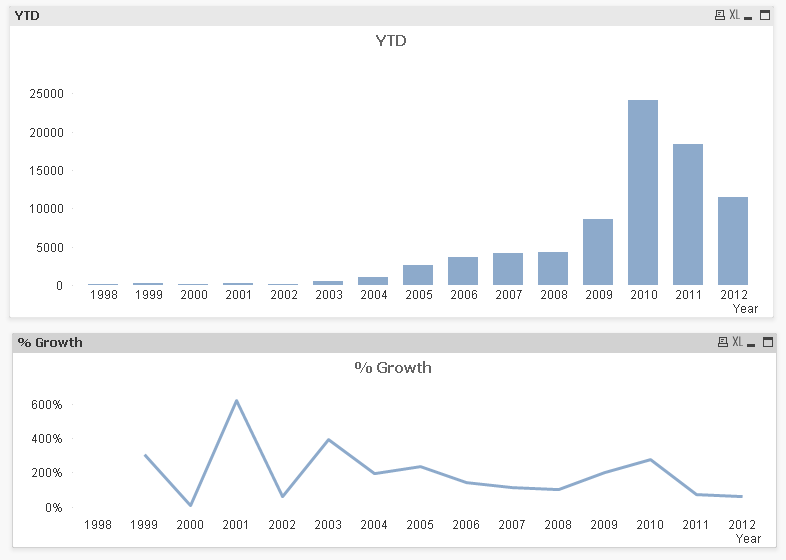
so what i want to show in combo graph like last 5 yrs and yoy growth
for ex
2012 500
2011 300
2010 200
so i want years of amount in bars and % of growth in line
if any body gives idea rearlly it helps me lot
pls see the sample attach file
- Mark as New
- Bookmark
- Subscribe
- Mute
- Subscribe to RSS Feed
- Permalink
- Report Inappropriate Content
See attached qvw. Is that the kind of chart you're looking for? It looks better if you use two charts instead of the combi chart.
talk is cheap, supply exceeds demand
- Mark as New
- Bookmark
- Subscribe
- Mute
- Subscribe to RSS Feed
- Permalink
- Report Inappropriate Content
hai friend
it seems to look correct
but the growth line is not touching cuurent year
- Mark as New
- Bookmark
- Subscribe
- Mute
- Subscribe to RSS Feed
- Permalink
- Report Inappropriate Content
Hai The % of growth is not coming fine
pls check the logic and provide another logic
it would great help for me
- Mark as New
- Bookmark
- Subscribe
- Mute
- Subscribe to RSS Feed
- Permalink
- Report Inappropriate Content
may i send my application can u pls do that yoy i am still struggling with that thing
- Mark as New
- Bookmark
- Subscribe
- Mute
- Subscribe to RSS Feed
- Permalink
- Report Inappropriate Content
Check this out http://community.qlik.com/message/122958#122958
It worked out for me.