Unlock a world of possibilities! Login now and discover the exclusive benefits awaiting you.
- Qlik Community
- :
- All Forums
- :
- QlikView App Dev
- :
- Re: How to Group Values within a Field and show on...
- Subscribe to RSS Feed
- Mark Topic as New
- Mark Topic as Read
- Float this Topic for Current User
- Bookmark
- Subscribe
- Mute
- Printer Friendly Page
- Mark as New
- Bookmark
- Subscribe
- Mute
- Subscribe to RSS Feed
- Permalink
- Report Inappropriate Content
How to Group Values within a Field and show on Bar Chart
Hi,
I have a chart with two dimensions ("Region", "Case Type") and one expression ("Hours"). My chart currently looks like below:
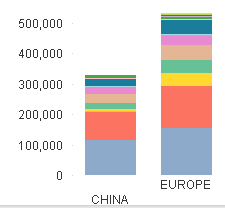
The numbers on the Y-axis denote the "Hours". X-axis has the "Region" values and different "Case Type"s are stacked for each region (each case type colored differently).
I'd like to know if I can put a number of these "case type"s into different groups. Do you have any suggestions on how to achieve this?
To give an example - Let's say "Case Type" dimension has a total of 5 values: AB, CD, EF, GH, IK. What I'd like to do is group these different fields - like 'AB' and 'CD' become 'Field_1', 'EF' and 'GH' become 'Field_2', and 'IK' stays as 'IK'. In the end, I'd like to show these grouped values ('Field_1', 'Field_2' and 'IK') stacked for each region (3 colors instead of 5 colors for each region).
I can't use grouping, since grouping works for different fields and I'm trying to group different values for a field.
Thanks in advance,
Accepted Solutions
- Mark as New
- Bookmark
- Subscribe
- Mute
- Subscribe to RSS Feed
- Permalink
- Report Inappropriate Content
If you nest if statements you need to make sure all the parentheses match:
=If(Match([Case Type], 'AB EXAMPLE', 'EXAMPLE CD'), 'Field 1',
If(Match([Case Type], 'EF', 'GH'), 'Field 2',
If(Match([Case Type], 'EF EXAMPLE', 'EXAMPLE GH'), 'Field 3',
If(Match([Case Type], 'DD EXAMPLE', 'EXAMPLE EE'), 'Field 4',
If(Match([Case Type], 'DC EXAMPLE'), 'Field 5', 'IK EXAMPLE')))))
That said, you should probably create an extra field in the script using a mapping table and applymap. That will perform a lot better than if statements nested four levels deep.
talk is cheap, supply exceeds demand
- Mark as New
- Bookmark
- Subscribe
- Mute
- Subscribe to RSS Feed
- Permalink
- Report Inappropriate Content
Create either a new field in the script or a calculated dimension in your chart (the former is the better option). Something like:
if(match([Case Type],'AB','CD'),'Field_1',if(match([Case Type],'EF','GH'),'Field_2','IK'))
talk is cheap, supply exceeds demand
- Mark as New
- Bookmark
- Subscribe
- Mute
- Subscribe to RSS Feed
- Permalink
- Report Inappropriate Content
Thanks for your answer Gysbert. I'm using the calculated dimension method however it gives me a syntax error.
I'm using this expression in the "Edit Expression" window:
If(Match([Case Type], 'AB', 'CD'), 'Field_1', If(Match([Case Type], 'EF', 'GH'), 'Field_2', 'IK'))
Am i doing something wrong?
- Mark as New
- Bookmark
- Subscribe
- Mute
- Subscribe to RSS Feed
- Permalink
- Report Inappropriate Content
HI
Expression is correct.
=If(Match([Case Type], 'AB', 'CD'), 'Field_1', If(Match([Case Type], 'EF', 'GH'), 'Field_2', 'IK'))
Can you post a sample file or screenshot ur expression with error msg?
Please close the thread by marking correct answer & give likes if you like the post.
- Mark as New
- Bookmark
- Subscribe
- Mute
- Subscribe to RSS Feed
- Permalink
- Report Inappropriate Content
If you get a syntax error the most likely cause is that Case Type is not the name of your dimension. You posted that Case Type was the dimension so that's what I used. Replace Case Type with the exact name of your dimension.
talk is cheap, supply exceeds demand
- Mark as New
- Bookmark
- Subscribe
- Mute
- Subscribe to RSS Feed
- Permalink
- Report Inappropriate Content
no, that's not the problem.
- Mark as New
- Bookmark
- Subscribe
- Mute
- Subscribe to RSS Feed
- Permalink
- Report Inappropriate Content
Thanks for the answer Mayil. I'm not writing that exact expression (which I gave as an example above). Sorry for not being very clear.
This is the expression that I'm writing in the "Calculated Dimension" - Dimension name and field names are modified (I'm using QlikView 11) :
=If(Match([Case Type], 'AB EXAMPLE', 'EXAMPLE CD'), 'Field 1', If(Match([Case Type], 'EF', 'GH'), 'Field 2',
If(Match([Case Type], 'EF EXAMPLE', 'EXAMPLE GH'), 'Field 3', If(Match([Case Type], 'DD EXAMPLE', 'EXAMPLE EE'), 'Field 4', If(Match([Case Type], 'DC EXAMPLE'), 'Field 5', 'IK EXAMPLE'))
- Mark as New
- Bookmark
- Subscribe
- Mute
- Subscribe to RSS Feed
- Permalink
- Report Inappropriate Content
Can you upload the sample application
- Mark as New
- Bookmark
- Subscribe
- Mute
- Subscribe to RSS Feed
- Permalink
- Report Inappropriate Content
If you nest if statements you need to make sure all the parentheses match:
=If(Match([Case Type], 'AB EXAMPLE', 'EXAMPLE CD'), 'Field 1',
If(Match([Case Type], 'EF', 'GH'), 'Field 2',
If(Match([Case Type], 'EF EXAMPLE', 'EXAMPLE GH'), 'Field 3',
If(Match([Case Type], 'DD EXAMPLE', 'EXAMPLE EE'), 'Field 4',
If(Match([Case Type], 'DC EXAMPLE'), 'Field 5', 'IK EXAMPLE')))))
That said, you should probably create an extra field in the script using a mapping table and applymap. That will perform a lot better than if statements nested four levels deep.
talk is cheap, supply exceeds demand
- Mark as New
- Bookmark
- Subscribe
- Mute
- Subscribe to RSS Feed
- Permalink
- Report Inappropriate Content
Hi Gysbert,
Thanks for the tip. I have one more requirement in the below expression.
=If(Match([Case Type], 'AB EXAMPLE', 'EXAMPLE CD'), 'Field 1',
If(Match([Case Type], 'EF', 'GH'), 'Field 2',
If(Match([Case Type], 'EF EXAMPLE', 'EXAMPLE GH'), 'Field 3',
If(Match([Case Type], 'DD EXAMPLE', 'EXAMPLE EE'), 'Field 4',
If(Match([Case Type], 'DC EXAMPLE'), 'Field 5', 'IK EXAMPLE')))))
For Eg: If Field 2 does not have any value, it is not getting displayed in the chart. I have tried removing the Suppress Null option. But it did not work out.
I want to have Field 2 and it should show as zero. How can I achieve it? Thanks in advance.