Unlock a world of possibilities! Login now and discover the exclusive benefits awaiting you.
- Qlik Community
- :
- All Forums
- :
- QlikView
- :
- Values on data points in Scatter Chart
- Subscribe to RSS Feed
- Mark Topic as New
- Mark Topic as Read
- Float this Topic for Current User
- Bookmark
- Subscribe
- Mute
- Printer Friendly Page
- Mark as New
- Bookmark
- Subscribe
- Mute
- Subscribe to RSS Feed
- Permalink
- Report Inappropriate Content
Values on data points in Scatter Chart
Hi
I have made a Scatter Chart where i have mapped a macine and i am counting the amount of Notifications put in or system.
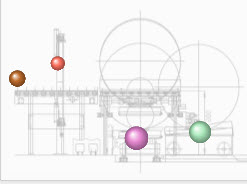
The more notifications, the bigger dots.
I would like to have the values shown on the dots, how can i do that? The option for Values on Data points is gray and i can not check this box.
Best regards
/Mats
- Tags:
- new_to_qlikview
- Mark as New
- Bookmark
- Subscribe
- Mute
- Subscribe to RSS Feed
- Permalink
- Report Inappropriate Content
Unfortunately this is not possible.
HIC
- Mark as New
- Bookmark
- Subscribe
- Mute
- Subscribe to RSS Feed
- Permalink
- Report Inappropriate Content
Maybe it is an option to use the 'Text as Pop-up'. Using the definition of the expression, combined with the 'dual' function, you can achieve a pretty fancy label (value).
- Mark as New
- Bookmark
- Subscribe
- Mute
- Subscribe to RSS Feed
- Permalink
- Report Inappropriate Content
Just in case this helps anyone else - (this is the first hit in google!) - you can add labels (at least you can in 11.2 SR2) -
Chart Properties -> Presentation -> Labels on Datapoints
- Mark as New
- Bookmark
- Subscribe
- Mute
- Subscribe to RSS Feed
- Permalink
- Report Inappropriate Content
You can also "trick" qlikview to show the data values by using the above option in conjunction with a calculated dimension and AGGR to concatenate the value to the dimension value. It's not the most elegant, but it works.
- Mark as New
- Bookmark
- Subscribe
- Mute
- Subscribe to RSS Feed
- Permalink
- Report Inappropriate Content
Can you provide details on this workaround?
In the attached, my third expression is Sum(Margin) and it doesn't appear in the popup when you hover over one of the bubbles.
Thanks,