Unlock a world of possibilities! Login now and discover the exclusive benefits awaiting you.
- Qlik Community
- :
- All Forums
- :
- QlikView App Dev
- :
- Show all dimensions on x-axis
- Subscribe to RSS Feed
- Mark Topic as New
- Mark Topic as Read
- Float this Topic for Current User
- Bookmark
- Subscribe
- Mute
- Printer Friendly Page
- Mark as New
- Bookmark
- Subscribe
- Mute
- Subscribe to RSS Feed
- Permalink
- Report Inappropriate Content
Show all dimensions on x-axis
My dimension responsible for the x-axis in my chart is Week. I have another dimension, CaseType, which plots the lines in my line graph. My data comes in with either a number for CaseType, or it simply doesn't list the CaseType value if there aren't any for that type of case that week. I would like to show a 0 value on for the Week if the number of Cases is Null.
Dimensions:
Week
CateType
My expression is:
If(IsNull(Cases), 0, Sum(Cases))
I have also tried the expression:
Sum(Cases)
I have the following settings for the Week dimension in the Dimensions tab:
Suppress When Value is Null - enabled
Show All Values - enabled
I have also tried displaying with each of these values disabled.
I have the following settings for the Week dimension in the Presentation tab:
Suppress Zero-Values - disabled
Zero on bars - disabled
Suppress Missing - disabled
I have also tried displaying with each of these values enabled
When I set up the axis to be Continuous, it always looks like this for a certain data selection.
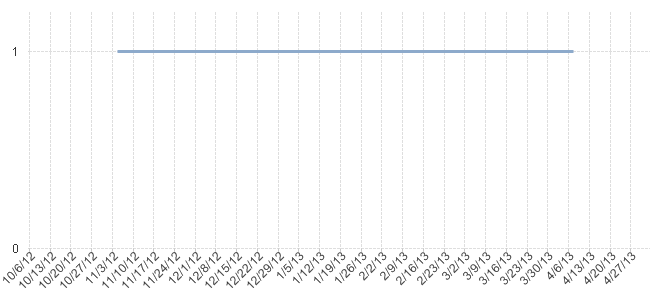
When it's not set up to be Continuous, it always looks like this for the same data selection.
Any advice?
Accepted Solutions
- Mark as New
- Bookmark
- Subscribe
- Mute
- Subscribe to RSS Feed
- Permalink
- Report Inappropriate Content
Thanks! That helped me to figure out what I was doing wrong. It's not that 0 values weren't plotting. It's that the values were completely null. Example of data I was loading:
| Date | Cases | CaseType |
|---|---|---|
| 1/1/2013 | 2 | A |
| 1/1/2013 | 1 | B |
| 2/1/2013 | 4 | B |
| 3/1/2013 | 2 | A |
| 3/1/2013 | 5 | B |
| 4/1/2013 | 2 | A |
| 5/1/2013 | 4 | A |
I changed my LOAD script to include a statement to add a value for every Date for every CaseType of 0 so that when I called on a CaseType for a date, there was always some kind of value, a number or 0.
For anyone with a similar issue, here's the code I used. (My data begins on 20/6/2012 and ends the day before the LOAD statement runs.)
LOAD Date((MakeDate(2012,6,19) + IterNo())) as Date,
CaseType,
'0' as Cases
FROM
(ooxml, embedded labels, table is Sheet1)
While IterNo() <= (Today()-MakeDate(2012,6,20));
- Mark as New
- Bookmark
- Subscribe
- Mute
- Subscribe to RSS Feed
- Permalink
- Report Inappropriate Content
I don't understand what's the exact problem about your graph. Although I think sum(Cases) as expression is correct for what you want.
- Mark as New
- Bookmark
- Subscribe
- Mute
- Subscribe to RSS Feed
- Permalink
- Report Inappropriate Content
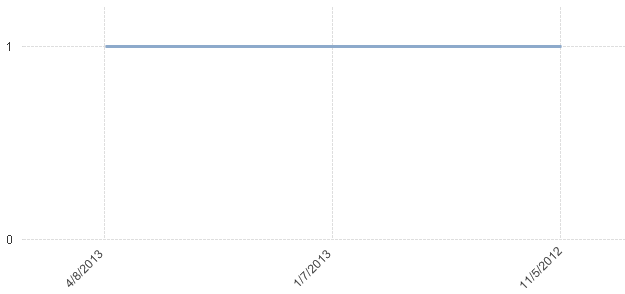
Here's what I would want/expect it to look like. Does that help? If not, what other information would help to explain the issue?

- Mark as New
- Bookmark
- Subscribe
- Mute
- Subscribe to RSS Feed
- Permalink
- Report Inappropriate Content
Well, I really don't get you problem but I'll enclose an example of what I'm guessing that you want to achieve.
- Mark as New
- Bookmark
- Subscribe
- Mute
- Subscribe to RSS Feed
- Permalink
- Report Inappropriate Content
Thanks! That helped me to figure out what I was doing wrong. It's not that 0 values weren't plotting. It's that the values were completely null. Example of data I was loading:
| Date | Cases | CaseType |
|---|---|---|
| 1/1/2013 | 2 | A |
| 1/1/2013 | 1 | B |
| 2/1/2013 | 4 | B |
| 3/1/2013 | 2 | A |
| 3/1/2013 | 5 | B |
| 4/1/2013 | 2 | A |
| 5/1/2013 | 4 | A |
I changed my LOAD script to include a statement to add a value for every Date for every CaseType of 0 so that when I called on a CaseType for a date, there was always some kind of value, a number or 0.
For anyone with a similar issue, here's the code I used. (My data begins on 20/6/2012 and ends the day before the LOAD statement runs.)
LOAD Date((MakeDate(2012,6,19) + IterNo())) as Date,
CaseType,
'0' as Cases
FROM
(ooxml, embedded labels, table is Sheet1)
While IterNo() <= (Today()-MakeDate(2012,6,20));