Unlock a world of possibilities! Login now and discover the exclusive benefits awaiting you.
- Qlik Community
- :
- All Forums
- :
- QlikView App Dev
- :
- Re: Concatenate fact tables
- Subscribe to RSS Feed
- Mark Topic as New
- Mark Topic as Read
- Float this Topic for Current User
- Bookmark
- Subscribe
- Mute
- Printer Friendly Page
- Mark as New
- Bookmark
- Subscribe
- Mute
- Subscribe to RSS Feed
- Permalink
- Report Inappropriate Content
Concatenate fact tables
Hi Community,
I have 2 fact tables that include exactly the same fields and I am trying to join them. Everything seems fine up until I try to calculate a bit more comple expressions
My fact tables are:
nv200_Data:
LOAD TestID,
Date(TestDate) as TestDate,
TestStatus,
if(TestStatus='Pass',1,0) as TestStatusBool,
UnitSerial,
UnitFirmware,
Month(TestDate) as TestMonth,
Year(TestDate) as TestYear,
Week(TestDate)as TestWeek,
Day(TestDate) As TestDay,
'Q' &Ceil(Month(TestDate)/3) as Quarter,
'1' as PassRateCounter,
'NV200' as ValidatorUnit,
'Initialisation' as Phase,
TestID&'-'&'NV200' as SensorValuesKey;
nv200_Data_2:
Concatenate(nv200_Data)
LOAD TestID,
Date(TestDate) as TestDate,
TestStatus,
if(TestStatus='Pass',1,0) as TestStatusBool,
UnitSerial,
UnitFirmware,
Month(TestDate) as TestMonth,
Year(TestDate) as TestYear,
Week(TestDate)as TestWeek,
Day(TestDate) As TestDay,
'Q' &Ceil(Month(TestDate)/3) as Quarter,
'1' as PassRateCounter,
'NV200' as ValidatorUnit,
'Reference' as Phase,
TestID&'-'&'NV200' as SensorValuesKey;
Simple expressions like are getting calculated correctly:
count({$<Phase={'Initialisation'}>}DISTINCT UnitSerial)
or
Count({$<TestStatus={'Pass'},Phase={'Initialisation'}>}DISTINCT UnitSerial)
The problem is if I try a more complex one like:
sum({<Phase={'Initialisation'}>}aggr(TestStatusBool,UnitSerial))
It does not calulate correctly.
Should I try a different approach no my model?? Or its just a miswritten expression
Regards,
Accepted Solutions
- Mark as New
- Bookmark
- Subscribe
- Mute
- Subscribe to RSS Feed
- Permalink
- Report Inappropriate Content
Try adding an aggregation function like sum() or only() with the set expression to your aggr() expression, too:
=sum({<Phase={'Initialisation'}>}aggr( sum({<Phase={'Initialisation'}>} TestStatusBool) ,UnitSerial))
Besides this, telling us that 'it does not calculate correctly' is not very helpful.
What do you expect? What do you see? How do your data look like?
- Mark as New
- Bookmark
- Subscribe
- Mute
- Subscribe to RSS Feed
- Permalink
- Report Inappropriate Content
No luck,
My data look like the attached image above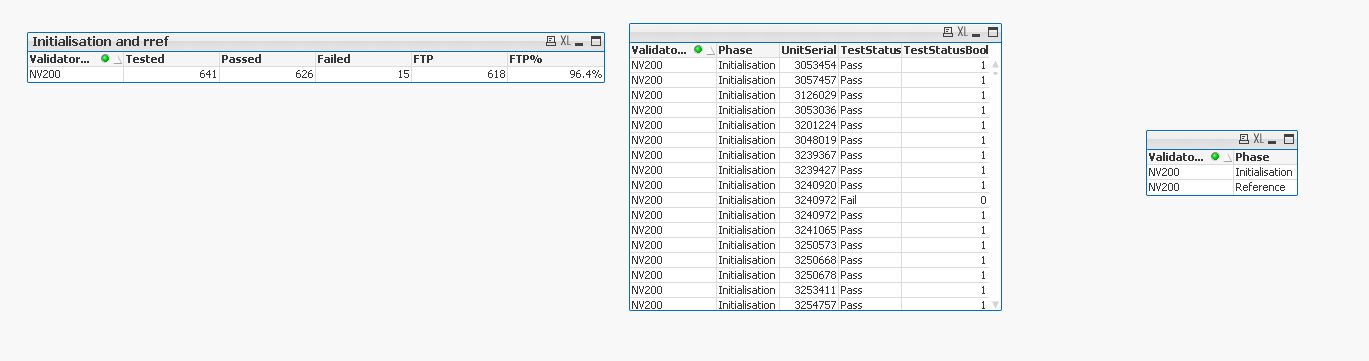
The first time pass rate should be lower than it calculates....
I should be getting 560 insted of 618 ftp
Expr:
count({$<Phase={'Initialisation'}>}DISTINCT UnitSerial)--->tested
Count({$<TestStatus={'Pass'},Phase={'Initialisation'}>}DISTINCT UnitSerial)--->passed
- Mark as New
- Bookmark
- Subscribe
- Mute
- Subscribe to RSS Feed
- Permalink
- Report Inappropriate Content
Expr:
count({$<Phase={'Initialisation'}>}DISTINCT UnitSerial)--->tested
Count({$<TestStatus={'Pass'},Phase={'Initialisation'}>}DISTINCT UnitSerial)--->passed
Hm, I think I am missing the expression for FTP?
- Mark as New
- Bookmark
- Subscribe
- Mute
- Subscribe to RSS Feed
- Permalink
- Report Inappropriate Content
Thanks for the quick responce swuehl...Only() did the trick 
- Mark as New
- Bookmark
- Subscribe
- Mute
- Subscribe to RSS Feed
- Permalink
- Report Inappropriate Content
Hi swuehl,
I have an extra question for you,.....
In the same model I have the straight table results like below:
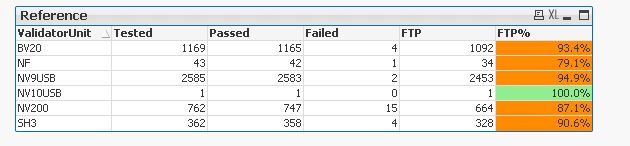
Is it possible to tranform them like :
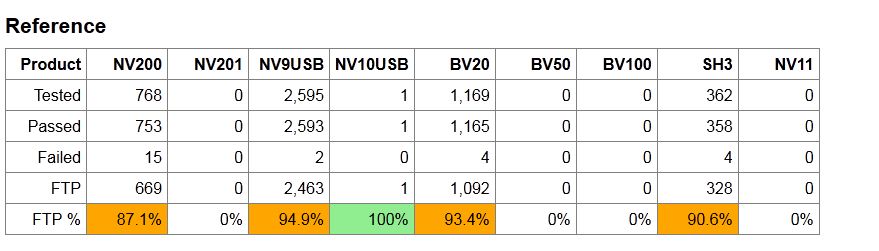
or at least add the products with no test results in mu straight table like above.
Thanks in advance for your precious time.
- Mark as New
- Bookmark
- Subscribe
- Mute
- Subscribe to RSS Feed
- Permalink
- Report Inappropriate Content
You can set the straight table chart layout to horizontal in presentation tab of chart properties.
Also try unchecking 'suppress zero values' in the same tab.
- Mark as New
- Bookmark
- Subscribe
- Mute
- Subscribe to RSS Feed
- Permalink
- Report Inappropriate Content
Horizontal ..check!!
About the suppress zero it is not going to solve the problem because I actualy do not bring in any data from products that had no test. In a way I want to create some dummy data or something like this...Is that possible??