Unlock a world of possibilities! Login now and discover the exclusive benefits awaiting you.
- Qlik Community
- :
- All Forums
- :
- QlikView App Dev
- :
- Re: Using visual cues in pivot table
- Subscribe to RSS Feed
- Mark Topic as New
- Mark Topic as Read
- Float this Topic for Current User
- Bookmark
- Subscribe
- Mute
- Printer Friendly Page
- Mark as New
- Bookmark
- Subscribe
- Mute
- Subscribe to RSS Feed
- Permalink
- Report Inappropriate Content
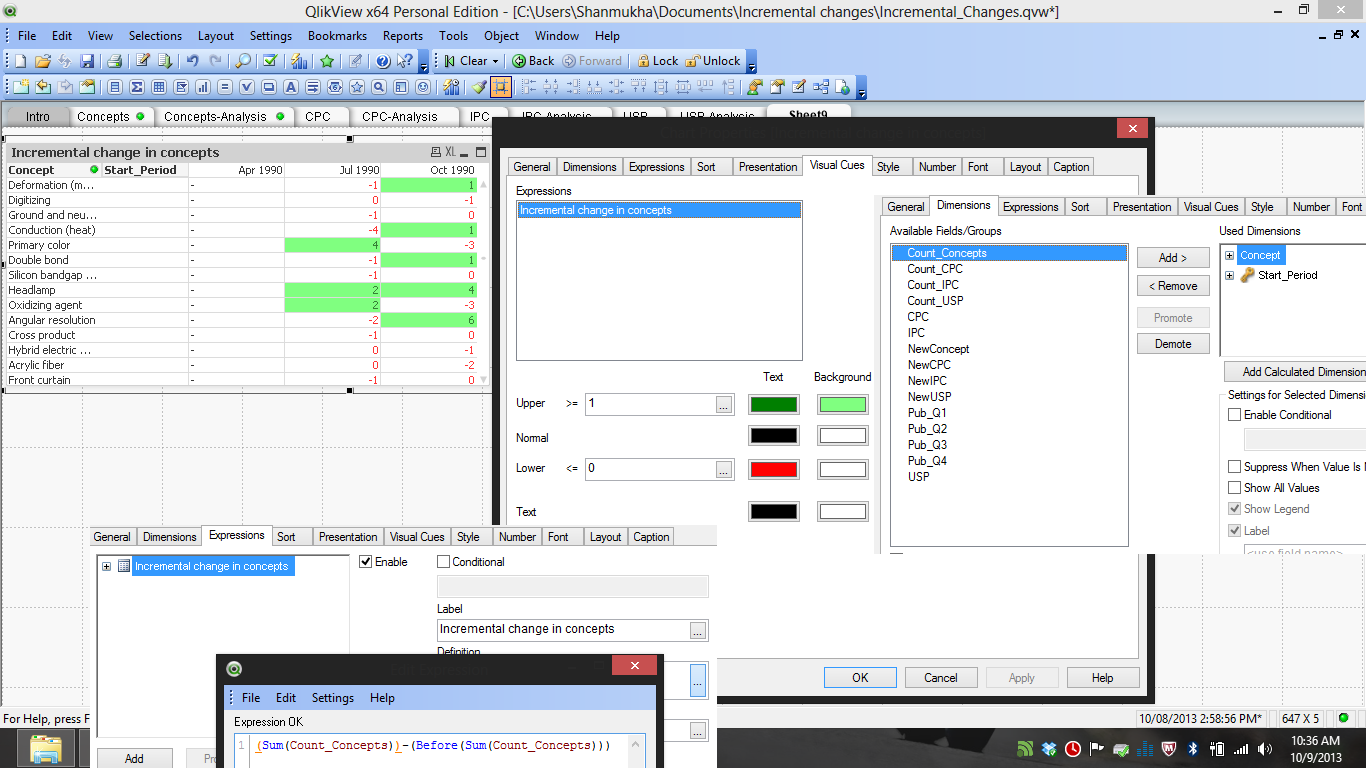
Using visual cues in pivot table
Hi,
I need to color the concepts in green which have green background for two consecutive columns (Ex: Headlamps)
and need to color the concepts in red which have red color font for two consecutive columns. (Ex: shutter speed, disk partitioning)
I have attached the pivot table, the dimensions, the expression used and the visual cues used.
Thanks in advance!
- Mark as New
- Bookmark
- Subscribe
- Mute
- Subscribe to RSS Feed
- Permalink
- Report Inappropriate Content
That case let it be blank, since it has random pattern.
I want to specifically identify the best and worst cases. 
and how do I do that ( previous month latest month thing ??)
- Mark as New
- Bookmark
- Subscribe
- Mute
- Subscribe to RSS Feed
- Permalink
- Report Inappropriate Content
Check Value for Latest month and previous Month.
If(Latest Month(Value)<0) and PrevMonth(Value)>0,Green,red)
Depends how you want to take it
- Mark as New
- Bookmark
- Subscribe
- Mute
- Subscribe to RSS Feed
- Permalink
- Report Inappropriate Content
what should be in value ?
- Mark as New
- Bookmark
- Subscribe
- Mute
- Subscribe to RSS Feed
- Permalink
- Report Inappropriate Content
I guess you are taking me wrong
Latest Month is not a function it is a field name of the latest month which consist of the values
- Mark as New
- Bookmark
- Subscribe
- Mute
- Subscribe to RSS Feed
- Permalink
- Report Inappropriate Content
I have no formal training in QV. Self learning mode.
Can you kindly type the expression based on my data and fields that I've used. Got the point but I'm not able to formulate it. 
Looks easy but I'm unable to do it. 
- Mark as New
- Bookmark
- Subscribe
- Mute
- Subscribe to RSS Feed
- Permalink
- Report Inappropriate Content
okay no problem.
you need to tell me how are you getting these values or from where you are getting this
Apr1990 Jul1990 Oct1990
these columns?
- Mark as New
- Bookmark
- Subscribe
- Mute
- Subscribe to RSS Feed
- Permalink
- Report Inappropriate Content
It is a dimension named Start_Period
- Mark as New
- Bookmark
- Subscribe
- Mute
- Subscribe to RSS Feed
- Permalink
- Report Inappropriate Content
Okay and its format is MMM-YYYY ? or those are text ?
- Mark as New
- Bookmark
- Subscribe
- Mute
- Subscribe to RSS Feed
- Permalink
- Report Inappropriate Content
SET DateFormat='MM/DD/YYYY';
SET TimestampFormat='MM/DD/YYYY h:mm:ss[.fff] TT';
SET MonthNames='Jan;Feb;Mar;Apr;May;Jun;Jul;Aug;Sep;Oct;Nov;Dec';
SET DayNames='Mon;Tue;Wed;Thu;Fri;Sat;Sun';
CONCEPT_TEMP:
LOAD MonthName(Start_Period) as Start_Period,
- Mark as New
- Bookmark
- Subscribe
- Mute
- Subscribe to RSS Feed
- Permalink
- Report Inappropriate Content
Okay thats nice,
Can you Load
CONCEPT_TEMP:
Load Date(Start_Period,'MMM-YYYY') as Start_Period,
and where does the below values comes from? i.e 1,2,-4,-3 etc?