Unlock a world of possibilities! Login now and discover the exclusive benefits awaiting you.
- Qlik Community
- :
- All Forums
- :
- QlikView
- :
- Re: Re: Conditional Subtotal of Pivot Table
- Subscribe to RSS Feed
- Mark Topic as New
- Mark Topic as Read
- Float this Topic for Current User
- Bookmark
- Subscribe
- Mute
- Printer Friendly Page
- Mark as New
- Bookmark
- Subscribe
- Mute
- Subscribe to RSS Feed
- Permalink
- Report Inappropriate Content
Conditional Subtotal of Pivot Table
Hi QV Community folks,
I am facing some problem with pivot table subtotals. Here is the screen shot of my current pivot table
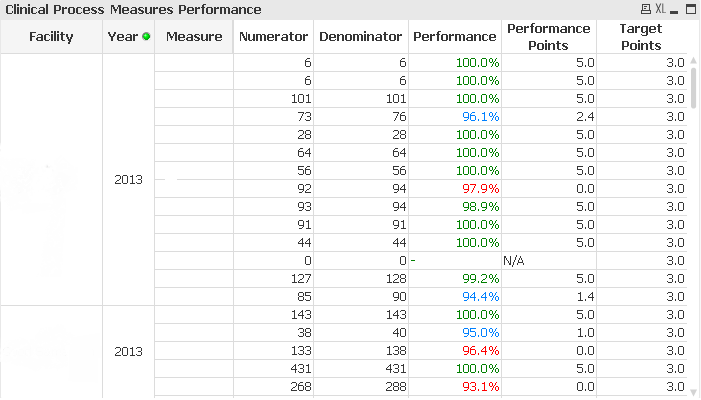
I wiped out the sensitive information, but what I want is that for each year (second dimension) my subtotal calculates the AVERAGE of the "performance points" column for all rows except for the rows with 'N/A'. Is there a way to accomplish this? The "performance points" is a calculated fields with nested if statement because of the complexity of the determination of the points
Thank you so much for any helpful guidance!
Best Regards,
Jihan
- « Previous Replies
-
- 1
- 2
- Next Replies »
- Mark as New
- Bookmark
- Subscribe
- Mute
- Subscribe to RSS Feed
- Permalink
- Report Inappropriate Content
Should be possible.
In your expression, you can use Dimensionality() to determine if the calculation is performed on subtotal or detail level, then conditionally choose an appropriate calculation.
avg() function should not take into consideration text values, so 'N/A' should be dismissed by default.
To tell you more, I think you need to tell us more details about the expression used etc.
- Mark as New
- Bookmark
- Subscribe
- Mute
- Subscribe to RSS Feed
- Permalink
- Report Inappropriate Content
Use expression something like:
=If(Dimensionality()<>1, YourExpressionForPerformance, Avg(Amountfield))
And then, enable Subtotal in presentation tab.
- Mark as New
- Bookmark
- Subscribe
- Mute
- Subscribe to RSS Feed
- Permalink
- Report Inappropriate Content
Hi Thank you for your quick reply. The following is my expression for the calculation of performance points column:
=
if(Denominator=0,'N/A',if(if(HPIP_Max<>HPIP_Min,1+(1-(HPIP_Max/100-Performance)/(HPIP_Max/100-HPIP_Min/100))*4,
if(Performance>=HPIP_Min/100,5,0))<0.99,0,if(if(HPIP_Max<>HPIP_Min,1+(1-(HPIP_Max/100-Performance)/(HPIP_Max/100-HPIP_Min/100))*4,
if(Performance>=HPIP_Min/100,5,0))>5,5,if(HPIP_Max<>HPIP_Min,1+(1-(HPIP_Max/100-Performance)/(HPIP_Max/100-HPIP_Min/100))*4,
if(Performance>=HPIP_Min/100,5,0)))))
HPIP_Max is the maximum performance value, HPIP_Min is the minimum performance value. I know if hard to figure out but basically, it checks how the current performance stands between the max and min value and assign a points.
Could you please explain dimensionality function a bit more. I used the help in QV but couldn't quite get it.
Thank you so much!
- Mark as New
- Bookmark
- Subscribe
- Mute
- Subscribe to RSS Feed
- Permalink
- Report Inappropriate Content
Could you please explain more about the dimensionality function for send me some reference link?
Thank you so much!
- Mark as New
- Bookmark
- Subscribe
- Mute
- Subscribe to RSS Feed
- Permalink
- Report Inappropriate Content
It's not really complicated, have you looked at the samples in the Help file?
Just create another expression,
=Dimensionality()
and check the results in your table, with a subtotal for Year dimension, you should get values 3 for detail lines and 1 for subtotal lines, if I see it correctly. So you can check against these values to decide which calculation to perform.
In your above expression, Performance is an expression label, right?
You might need to use advanced aggregation and the original expressions instead the label to calculate your average.
- Mark as New
- Bookmark
- Subscribe
- Mute
- Subscribe to RSS Feed
- Permalink
- Report Inappropriate Content
Yes, Denominator and Performance are all expression labels? They would cause any problem?
- Mark as New
- Bookmark
- Subscribe
- Mute
- Subscribe to RSS Feed
- Permalink
- Report Inappropriate Content
From help:
Returns the number of dimension columns that have non-aggregation content. i.e. do not contain partial sums or collapsed aggregates.
A typical use is in attribute expressions, when you want to apply different cell formatting depending on aggregation level of data.
This function is only available in charts. For all chart types except pivot table it will return the number of dimensions in all rows except the total, which will be 0.
PFA for understanding with example
- Mark as New
- Bookmark
- Subscribe
- Mute
- Subscribe to RSS Feed
- Permalink
- Report Inappropriate Content
Thank you Tresesco for the great example. Now I figured out the dimentionality() function; however, QV doesn't seem to like my expression:
if(Denominator=0,'N/A',if(if(HPIP_Max<>HPIP_Min,1+(1-(HPIP_Max/100-Performance)/(HPIP_Max/100-HPIP_Min/100))*4,
if(Performance>=HPIP_Min/100,5,0))<0.99,0,if(if(HPIP_Max<>HPIP_Min,1+(1-(HPIP_Max/100-Performance)/(HPIP_Max/100-HPIP_Min/100))*4,
if(Performance>=HPIP_Min/100,5,0))>5,5,if(HPIP_Max<>HPIP_Min,1+(1-(HPIP_Max/100-Performance)/(HPIP_Max/100-HPIP_Min/100))*4,
if(Performance>=HPIP_Min/100,5,0)))))
Denominator and Performance are both lables for some calculated expressions. If I want to calculate the average of the above expression, what would be the correct way?
Thank you again for your time and patience.
- Mark as New
- Bookmark
- Subscribe
- Mute
- Subscribe to RSS Feed
- Permalink
- Report Inappropriate Content
Well, the problem that I'm now facing is that for the subtotal row, there is no Threshold values (i.e. HPIP_Max and HPIP_Min) in the performance point calculation formula. I just want it to look at all the row above and get the average of Performance Points. Is there a way to do so?
Sorry for keep bugging you, I'm quite new to QV and there's so much to learn.
Thanks again for your patience!
- « Previous Replies
-
- 1
- 2
- Next Replies »