Unlock a world of possibilities! Login now and discover the exclusive benefits awaiting you.
- Qlik Community
- :
- All Forums
- :
- QlikView App Dev
- :
- Re: "Zoom in" on line-chart to make values readabl...
- Subscribe to RSS Feed
- Mark Topic as New
- Mark Topic as Read
- Float this Topic for Current User
- Bookmark
- Subscribe
- Mute
- Printer Friendly Page
- Mark as New
- Bookmark
- Subscribe
- Mute
- Subscribe to RSS Feed
- Permalink
- Report Inappropriate Content
"Zoom in" on line-chart to make values readable
Hello community,
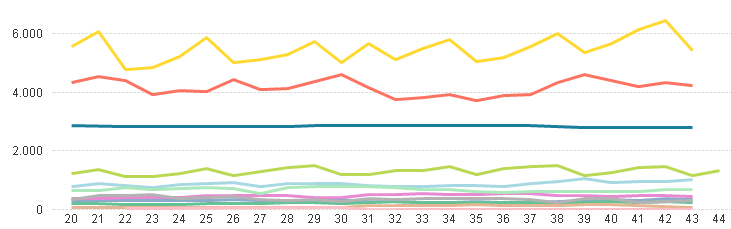
In below chart you can see amount of products over weeks.
The three products above 3000 make this chart hard to read, especially for the smaller amounts. Is there any way to "zoom in" on those products below 2000 without de-selecting the three products above 3000?
Thank you.
Accepted Solutions
- Mark as New
- Bookmark
- Subscribe
- Mute
- Subscribe to RSS Feed
- Permalink
- Report Inappropriate Content
Maybe like attached
On second tab, a slider is used to set the max scale.
On third tab, an expression is used to calculate the max y value of the remaining lines (assuming one knows what lines to remove from that calculation).
- Mark as New
- Bookmark
- Subscribe
- Mute
- Subscribe to RSS Feed
- Permalink
- Report Inappropriate Content
You can set the maximum y-scale value on axis tab, potentially using an expression.
So you can use a slider / input box to set the range, or try to determine the max value of the remaining lines by an expression.
- Mark as New
- Bookmark
- Subscribe
- Mute
- Subscribe to RSS Feed
- Permalink
- Report Inappropriate Content
thanks for the info. Is there any example out there I could learn from? At the moment I don't have much of an idea what kind of expression to use.
- Mark as New
- Bookmark
- Subscribe
- Mute
- Subscribe to RSS Feed
- Permalink
- Report Inappropriate Content
Maybe using a Log Scale, just guessing if fits to your needs
- Mark as New
- Bookmark
- Subscribe
- Mute
- Subscribe to RSS Feed
- Permalink
- Report Inappropriate Content
Maybe like attached
On second tab, a slider is used to set the max scale.
On third tab, an expression is used to calculate the max y value of the remaining lines (assuming one knows what lines to remove from that calculation).
- Mark as New
- Bookmark
- Subscribe
- Mute
- Subscribe to RSS Feed
- Permalink
- Report Inappropriate Content
Great. Thanks a lot for this example using two methods. This should get me to how I want the chart to look like.