Unlock a world of possibilities! Login now and discover the exclusive benefits awaiting you.
- Qlik Community
- :
- All Forums
- :
- QlikView App Dev
- :
- Re: Excel "No Calculation" Pivot Feature in QlikVi...
- Subscribe to RSS Feed
- Mark Topic as New
- Mark Topic as Read
- Float this Topic for Current User
- Bookmark
- Subscribe
- Mute
- Printer Friendly Page
- Mark as New
- Bookmark
- Subscribe
- Mute
- Subscribe to RSS Feed
- Permalink
- Report Inappropriate Content
Excel "No Calculation" Pivot Feature in QlikView?
Hi,
I'm actually working with a pivot table and I'm trying to display it Excel-like in QlikView.
Here is a screenshot of the pivot table in Excel:
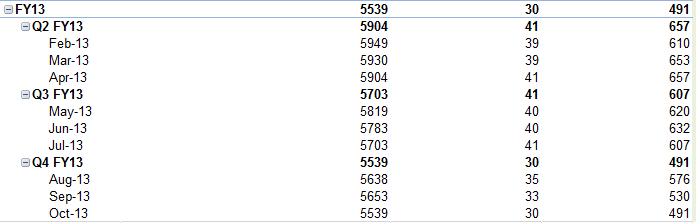
I'm now trying to build it up similarly in QlikView, so that for monthly basis the numbers will get summed up and if I aggregate them to a quarterly level, I want the pivot table to show the last monthly-value of the specific quarter. E.g. for Q2 FY13 I need to display the sum of values for Apr-13 (in this case 657). Same goes for quarter and year aggregation.
In excel you can simply state "No Calculation" and then it's doing it the way shown above, but I can't find a way to do it with QlikView.
Does anyone has an idea on how to do it?
Any help is appreciated very much.
Kind regards,
TK
Accepted Solutions
- Mark as New
- Bookmark
- Subscribe
- Mute
- Subscribe to RSS Feed
- Permalink
- Report Inappropriate Content
You can either try using Dimensionality() in a conditional in your expression to branch into different calculations or maybe using FirstSortedValue, something like
=FirstSortedValue( aggr( sum(Value), Year, Quarter, MonthField), aggr(-MonthField, Year, Quarter, MonthField) )
- Mark as New
- Bookmark
- Subscribe
- Mute
- Subscribe to RSS Feed
- Permalink
- Report Inappropriate Content
You Sir, are a genius! 
Thank you very much, this was exactly what I was looking for!
Kind regards,
TK