Unlock a world of possibilities! Login now and discover the exclusive benefits awaiting you.
- Qlik Community
- :
- All Forums
- :
- QlikView App Dev
- :
- Re: How to make my bar chart label on coy name sho...
- Subscribe to RSS Feed
- Mark Topic as New
- Mark Topic as Read
- Float this Topic for Current User
- Bookmark
- Subscribe
- Mute
- Printer Friendly Page
- Mark as New
- Bookmark
- Subscribe
- Mute
- Subscribe to RSS Feed
- Permalink
- Report Inappropriate Content
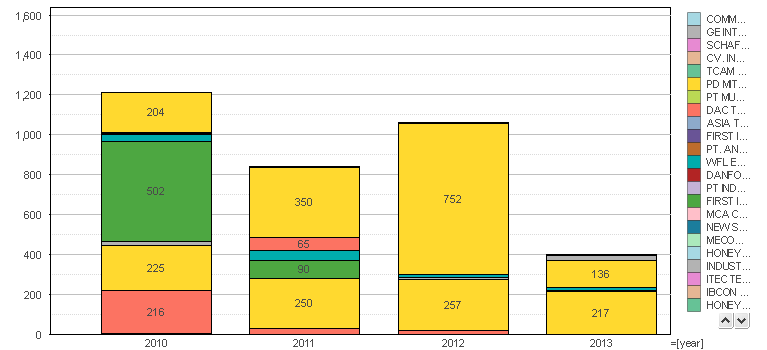
How to make my bar chart label on coy name show only less then 9 company.
Hi All
I have a chart which is working very well.
But the label does not show only those company name appear on the bar color. now my chart have less then 9 color , which is represent by only 9 company. but the right side of the chart label display full list of company. which unable know those affected sales drop company name.
Paul
Accepted Solutions
- Mark as New
- Bookmark
- Subscribe
- Mute
- Subscribe to RSS Feed
- Permalink
- Report Inappropriate Content
Hi All
I found the solution , i need to select the segment in order to filter those company i want to see.
- Mark as New
- Bookmark
- Subscribe
- Mute
- Subscribe to RSS Feed
- Permalink
- Report Inappropriate Content
Hi All
I found the solution , i need to select the segment in order to filter those company i want to see.
- Mark as New
- Bookmark
- Subscribe
- Mute
- Subscribe to RSS Feed
- Permalink
- Report Inappropriate Content
You can limit the number of companies in dimension limits tab on that chart.Right click on the chart, click dimension limits tab, enable 'restrict which values are displayed using the first expression'. select show only, and enter the number of values to be displayed.
Regards.
siva
- Mark as New
- Bookmark
- Subscribe
- Mute
- Subscribe to RSS Feed
- Permalink
- Report Inappropriate Content
Hi Siva
I aware of what you said. But that does not work.
As you notice that my chart right hand side show many company , more then 100 company name . But my chart only have few company. My solution is i need to filter the data , to make it show only those company i want to analyse. with out that , it will not be able to solve it. As my chart expression is not sum(sales).
Any way thank you very much.
Paul
- Mark as New
- Bookmark
- Subscribe
- Mute
- Subscribe to RSS Feed
- Permalink
- Report Inappropriate Content
Can You Post your sample app
- Mark as New
- Bookmark
- Subscribe
- Mute
- Subscribe to RSS Feed
- Permalink
- Report Inappropriate Content
Hi Nirmal
Tab = sheet 30 , this page is the chart i ref to .
Dropbox - 000_QVD_v815 ask final Master.qvw
Now working fine.
Paul