Unlock a world of possibilities! Login now and discover the exclusive benefits awaiting you.
- Qlik Community
- :
- All Forums
- :
- QlikView App Dev
- :
- Re: Graph dimension question
- Subscribe to RSS Feed
- Mark Topic as New
- Mark Topic as Read
- Float this Topic for Current User
- Bookmark
- Subscribe
- Mute
- Printer Friendly Page
- Mark as New
- Bookmark
- Subscribe
- Mute
- Subscribe to RSS Feed
- Permalink
- Report Inappropriate Content
Graph dimension question
Hi,
I have a couple of line charts with the following dimensions and expressoins.
Chart 1:
Dimension: StartIntervalTime
Expression: COUNT(DataEventID)
Chart 2:
Dimension: EndIntervalTime
Expression: COUNT(DataEventID)
These produce the following two charts:
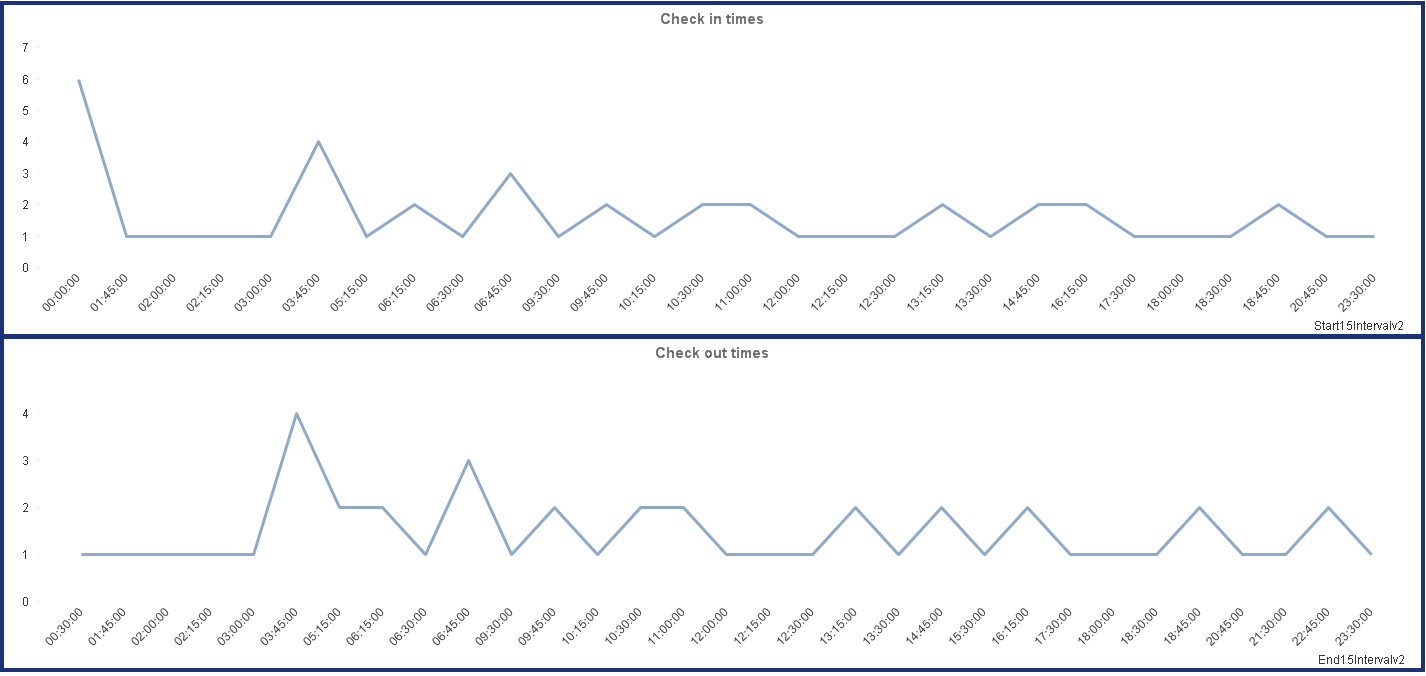
I however want to show both the graphs on a single chart. Usually I would simply add another expression but here both the charts are running from a different dimension.
How can I get both graphs onto the same chart?
Thanks in advance for your help with this.
Dan
Accepted Solutions
- Mark as New
- Bookmark
- Subscribe
- Mute
- Subscribe to RSS Feed
- Permalink
- Report Inappropriate Content
see attachment
- Mark as New
- Bookmark
- Subscribe
- Mute
- Subscribe to RSS Feed
- Permalink
- Report Inappropriate Content
Hi,
From a single chart, use the second expression. Go to Axes tab, try to change the second expression possition to Right[top] and check the Split axes and change to value 50%.
- Mark as New
- Bookmark
- Subscribe
- Mute
- Subscribe to RSS Feed
- Permalink
- Report Inappropriate Content
Daniel,
I think the next approach will work:
Create data island with one field Intervals. Create chart with Intervals as dimension, and the next two expressions:
StartCount = COUNT(if(StartIntervalTime=Intervals, DataEventID))
EndCount = COUNT(if(EndIntervalTime=Intervals, DataEventID))
Warning: the performance maybe be poor with a large amount of data.
Regards,
Michael
- Mark as New
- Bookmark
- Subscribe
- Mute
- Subscribe to RSS Feed
- Permalink
- Report Inappropriate Content
Hi Dan, In the above case you need to create common IntervelTime (In Link table if required) for both fields and use this new field as the Dimension. Similarly create the FLAG weather its start or end .
Dimension: IntervelTime
Expression1: Count({<FLAG={'START'}>}DataEventID)
Expression2: Count({<FLAG={'END'}>}DataEventID)
- Mark as New
- Bookmark
- Subscribe
- Mute
- Subscribe to RSS Feed
- Permalink
- Report Inappropriate Content
see attachment
- Mark as New
- Bookmark
- Subscribe
- Mute
- Subscribe to RSS Feed
- Permalink
- Report Inappropriate Content
Here is a version with island (based on Massimo Grossi)