Unlock a world of possibilities! Login now and discover the exclusive benefits awaiting you.
- Qlik Community
- :
- All Forums
- :
- QlikView App Dev
- :
- Re: Labeling dimensions in a chart
- Subscribe to RSS Feed
- Mark Topic as New
- Mark Topic as Read
- Float this Topic for Current User
- Bookmark
- Subscribe
- Mute
- Printer Friendly Page
- Mark as New
- Bookmark
- Subscribe
- Mute
- Subscribe to RSS Feed
- Permalink
- Report Inappropriate Content
Labeling dimensions in a chart
I have a chart with Metrics in it which are showing on the axis. They are numbers from 36 to 41. I want it to show names I put in for each of these rather than the numbers. I have in: =if(MetricKey='36','%Interns',MetricKey) which shows %Interns instead of 36 but I need it to continue on and rename the other numbers which i havent been able to do. Any suggestions
Thanks in advance
- Mark as New
- Bookmark
- Subscribe
- Mute
- Subscribe to RSS Feed
- Permalink
- Report Inappropriate Content
Rhona
How about storing your dimension using the dual() function.
This will let you store / display both the numeric and text representation of the dimension.
Best Regards, Bill
- Mark as New
- Bookmark
- Subscribe
- Mute
- Subscribe to RSS Feed
- Permalink
- Report Inappropriate Content
Thanks Bill
I need to rename them just for this chart as they have other names for other charts and very long names that cant really be used. Can i use the dual function in the chart itself and can you give me an example
Sorry I am quiet new to this - in at the deep end.
- Mark as New
- Bookmark
- Subscribe
- Mute
- Subscribe to RSS Feed
- Permalink
- Report Inappropriate Content
Hi,
Try
class()
this will help you
Please appreciate our Qlik community members by giving Kudos for sharing their time for your query. If your query is answered, please mark the topic as resolved 🙂
- Mark as New
- Bookmark
- Subscribe
- Mute
- Subscribe to RSS Feed
- Permalink
- Report Inappropriate Content
Can you please post a sample QVW?
- Mark as New
- Bookmark
- Subscribe
- Mute
- Subscribe to RSS Feed
- Permalink
- Report Inappropriate Content
Hi Rohan,
If you want to rename the dimension , In dimensions tab Label available for every dimension ,Just change the name there it automatically show in the chart as it is.
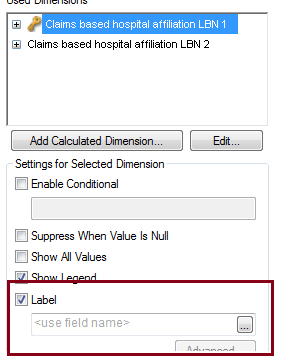
I hope this helps..
Regards,
Koti