Unlock a world of possibilities! Login now and discover the exclusive benefits awaiting you.
- Qlik Community
- :
- All Forums
- :
- QlikView App Dev
- :
- Re: Top 10 sales
- Subscribe to RSS Feed
- Mark Topic as New
- Mark Topic as Read
- Float this Topic for Current User
- Bookmark
- Subscribe
- Mute
- Printer Friendly Page
- Mark as New
- Bookmark
- Subscribe
- Mute
- Subscribe to RSS Feed
- Permalink
- Report Inappropriate Content
Top 10 sales
Hi Guys ,
I have a table
Sno product sales
1 P 100
2 Q 150
3 R 110
4 P 200
5 Q 170
6 P 240
7 P 160
--
--
--
--
--
Like this i haev number of rows , now my Question is
I want to caluculate Top 10 sales of product='P' in a chart , Can anybody please assist me on this
Thanks
Nani
- Mark as New
- Bookmark
- Subscribe
- Mute
- Subscribe to RSS Feed
- Permalink
- Report Inappropriate Content
Please take a look at the example.
- Mark as New
- Bookmark
- Subscribe
- Mute
- Subscribe to RSS Feed
- Permalink
- Report Inappropriate Content
Thanks sudeep,
But in my case i have to show two exp in a pie chart like below
1) Top ten sales of a product 'p'
2)sales of remaining products
Only exp i have to use here no dimensions ..
Thanks
Nani
- Mark as New
- Bookmark
- Subscribe
- Mute
- Subscribe to RSS Feed
- Permalink
- Report Inappropriate Content
Can any one plese assist me on this...
- Mark as New
- Bookmark
- Subscribe
- Mute
- Subscribe to RSS Feed
- Permalink
- Report Inappropriate Content
Please find the attached sample Test application.
Hope it is what you are expecting.
-Regards,
Neha
- Mark as New
- Bookmark
- Subscribe
- Mute
- Subscribe to RSS Feed
- Permalink
- Report Inappropriate Content
Thanks for the reply Neha
Here is my Question
i want to write 2 exp in pie chart
1)top ten sales of product 'P'
2) remaining sales of prodct 'P' only
Regards
Nani
- Mark as New
- Bookmark
- Subscribe
- Mute
- Subscribe to RSS Feed
- Permalink
- Report Inappropriate Content
Hi Nani,
I hope you are trying to display the top 10 sales of product 'P' and other than top 10 sales of the same.
In pie chart only one expression can be plotted at a time. To get this you can use Conditional Expression.
Hope it will help you.
Regards.
PS
- Mark as New
- Bookmark
- Subscribe
- Mute
- Subscribe to RSS Feed
- Permalink
- Report Inappropriate Content
= if(rank(sum({$<product={"P"}>}sales))<10,sum({$<product={"P"}>}sales))
- Mark as New
- Bookmark
- Subscribe
- Mute
- Subscribe to RSS Feed
- Permalink
- Report Inappropriate Content
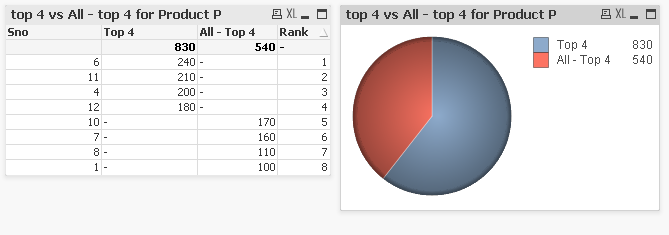
Please take a look at the example. I've done it for top 4 but you can change it to top 10.
I'm still looking to make it little more optimized.
- Mark as New
- Bookmark
- Subscribe
- Mute
- Subscribe to RSS Feed
- Permalink
- Report Inappropriate Content
Hai Nani,
If(Rank(Sum({<[product ]={'P'}>}Sales),10)<=10,Sum({<[product ]={'P'}>}Sales))