Unlock a world of possibilities! Login now and discover the exclusive benefits awaiting you.
- Qlik Community
- :
- Forums
- :
- Groups
- :
- Location and Language
- :
- Francophones
- :
- Re: Re: calculer et mettre en graphe une part de m...
- Subscribe to RSS Feed
- Mark Topic as New
- Mark Topic as Read
- Float this Topic for Current User
- Bookmark
- Subscribe
- Mute
- Printer Friendly Page
- Feature this Topic
- Mark as New
- Bookmark
- Subscribe
- Mute
- Subscribe to RSS Feed
- Permalink
- Report Inappropriate Content
calculer et mettre en graphe une part de marché ?
je suis débutant dans qlikview et suis bloqué pour ma première utilisation des expressions dans les graphes.
Je cherche à claculer dans une expression la part de marché d'un produit dans son marché spécifique à partir par exemple d'une table à la structure suivante.
PRODUIT,MARCHE,MONTH,SALES
pouvez vous m'aider merci
- Tags:
- Group_Discussions
- Mark as New
- Bookmark
- Subscribe
- Mute
- Subscribe to RSS Feed
- Permalink
- Report Inappropriate Content
Soit tu mets des listes de sélections dans ton application pour permettre à tes utilisateurs de sélectionner le marché et le produits.
Soit tu utilises les set analysis (sur google tu trouves plein de trucs  )
)
- Mark as New
- Bookmark
- Subscribe
- Mute
- Subscribe to RSS Feed
- Permalink
- Report Inappropriate Content
merci,
effectivement je comprends que les set analysis permettent à des expressions de prendre un contexte qui n'est pas forcement le contexte "standard".
tu ne pourais pas m'aiguiller un peu juste sur la syntax de base pour l'expression qui correspond à une part de marché ?
comment traduire MS=somme du champ ventes pour le produit selectionné sur somme du champ ventes pour le marché du produit selectionné.
Encore merci pour ton retour
- Mark as New
- Bookmark
- Subscribe
- Mute
- Subscribe to RSS Feed
- Permalink
- Report Inappropriate Content
Alors pour un set analysis basique sur un marché précis, ça donnerai:
sum({<MARCHE = {'UnMarche'}>} Sales)
Dans ton exemple, tu veux récupérer les éléments de sélections, pour ça il faut utiliser GetFieldSelections, dans un set analysis:
sum({<MARCHE = {$(=GetFieldSelections(MARCHE))}>} Sales)
Ce PDF est vraiment bien fait pour comprendre les set analysis, en Français en plus:
http://pentier.free.fr/1-Formation%20Developper/Set%20Analysis/set_analysis.pdf
En espérant t'avoir aider, bon courage
Augustin
- Mark as New
- Bookmark
- Subscribe
- Mute
- Subscribe to RSS Feed
- Permalink
- Report Inappropriate Content
something like that?
- Mark as New
- Bookmark
- Subscribe
- Mute
- Subscribe to RSS Feed
- Permalink
- Report Inappropriate Content
yes, exactly !
please tell me how you managed to do this...
- Mark as New
- Bookmark
- Subscribe
- Mute
- Subscribe to RSS Feed
- Permalink
- Report Inappropriate Content
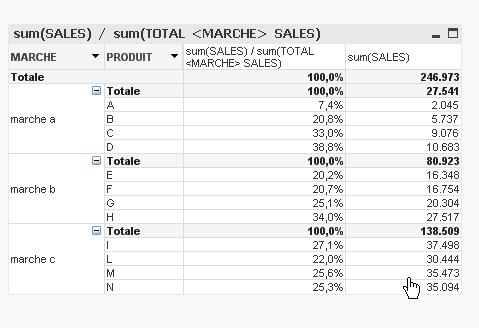
see attachment
expression is
sum(SALES) / sum(TOTAL <MARCHE> SALES)
- Mark as New
- Bookmark
- Subscribe
- Mute
- Subscribe to RSS Feed
- Permalink
- Report Inappropriate Content
many thanks for this.
too bad I have only a personal edition and I can't open material done by somebody else otherwise I will loose my license.
Sorry, may be you can copy past the structure of your samples data/expression in text (if not too much work)
Anyway I thank you very much, you'd been already of a great help to me !

- Mark as New
- Bookmark
- Subscribe
- Mute
- Subscribe to RSS Feed
- Permalink
- Report Inappropriate Content
pivot chart
- dimension
MARCHE
PRODUIT
- expression (I left the label of expressions empty, you can also osee expressions in image)
sum(SALES) / sum(TOTAL <MARCHE> SALES)
sum(SALES)
Script
I (Qlikview) created a test script (in script editor menu, insert, test script)
and the I changed the names of some fields (bold) to use your dimensions
SET ThousandSep='.';
SET DecimalSep=',';
SET MoneyThousandSep='.';
SET MoneyDecimalSep=',';
SET MoneyFormat='€ #.##0,00;-€ #.##0,00';
SET TimeFormat='hh:mm:ss';
SET DateFormat='DD/MM/YYYY';
SET TimestampFormat='DD/MM/YYYY hh:mm:ss[.fff]';
SET MonthNames='gen;feb;mar;apr;mag;giu;lug;ago;set;ott;nov;dic';
SET DayNames='lun;mar;mer;gio;ven;sab;dom';
//PRODUIT,MARCHE,MONTH,SALES
Characters:
Load Chr(RecNo()+Ord('A')-1) as Alpha, RecNo() as Num autogenerate 26;
ASCII:
Load
if(RecNo()>=65 and RecNo()<=90,RecNo()-64) as Num,
Chr(RecNo()) as AsciiAlpha,
RecNo() as AsciiNum
autogenerate 255
Where (RecNo()>=32 and RecNo()<=126) or RecNo()>=160 ;
Transactions:
Load
TransLineID,
TransID,
mod(TransID,26)+1 as Num,
Pick(Ceil(12*Rand1),'A','B','C','D','E','F','G','H','I','L','M','N','O') as PRODUIT,
'marche ' & Pick(Ceil(3*Rand1),'a','b','c','d','e','f', 'g', 'h') as MARCHE,
Pick(Ceil(3*Rand()),'X','Y','Z') as Dim3,
Round(1000*Rand()*Rand()*Rand1) as SALES,
Round( 10*Rand()*Rand()*Rand1) as Expression2,
Round(Rand()*Rand1,0.00001) as Expression3;
Load
Rand() as Rand1,
IterNo() as TransLineID,
RecNo() as TransID
Autogenerate 1000
While Rand()<=0.5 or IterNo()=1;
qlikview online help
search
chart aggregation function
- Mark as New
- Bookmark
- Subscribe
- Mute
- Subscribe to RSS Feed
- Permalink
- Report Inappropriate Content
thanks ! thanks ! thanks!
I will test it sometimes today, and I am pretty sure I will label my post as answered ! with a corect answer from you.
regards
thierry