Unlock a world of possibilities! Login now and discover the exclusive benefits awaiting you.
- Qlik Community
- :
- All Forums
- :
- QlikView Administration
- :
- Re: Set expression issue when using modifiers
- Subscribe to RSS Feed
- Mark Topic as New
- Mark Topic as Read
- Float this Topic for Current User
- Bookmark
- Subscribe
- Mute
- Printer Friendly Page
- Mark as New
- Bookmark
- Subscribe
- Mute
- Subscribe to RSS Feed
- Permalink
- Report Inappropriate Content
Set expression issue when using modifiers
This is my first app on QV and have been trying to learn QV as I develop.
I have been trying to use the master calendar (http://community.qlik.com/docs/DOC-6593) by @Richard.Pearce60 in my app and the expressions for MTD/ MTD prev. period don't seem to work.
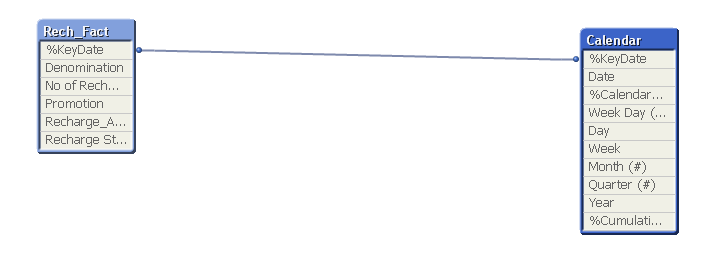
I have loaded the master calendar from a qvd and the fact table from a qvd
I am not sure where am going wrong and would appreciate any pointers
=sum({<Date={'$(=max(Date))'},%Flag_ThisMonthToDate={1} >} Measure_Name) is what I am using for MTD numbers
Would appreciate any pointers
Thanks,
- « Previous Replies
- Next Replies »
Accepted Solutions
- Mark as New
- Bookmark
- Subscribe
- Mute
- Subscribe to RSS Feed
- Permalink
- Report Inappropriate Content
Hi Iav,
The first set on numbers should be simple enough. Using the Flags we've discussed previously.
Cumulative numbers are a bit special and aren't covered by the Calendar. There are a number of threads on the subject but ultimately you need to use a formula which will look something like this:
=RangeSum( above( sum( "Here put the normal Calendar Flags, Calculation Field" ),0,rowno() ))
Richard
- Mark as New
- Bookmark
- Subscribe
- Mute
- Subscribe to RSS Feed
- Permalink
- Report Inappropriate Content
I guess, Date={$(=Max(Date))} portion should not be there in the set. Try without it and check the result.
=sum({<%Flag_ThisMonthToDate={1} >} Measure_Name)
- Mark as New
- Bookmark
- Subscribe
- Mute
- Subscribe to RSS Feed
- Permalink
- Report Inappropriate Content
=sum({<%Flag_ThisMonthToDate={1},Date={'>=$(=MonthStart(Max(Date)))<=$(=Max(Date))'} >}Recharge_AED)
- Mark as New
- Bookmark
- Subscribe
- Mute
- Subscribe to RSS Feed
- Permalink
- Report Inappropriate Content
Hi Iav,
Your expression looks good. If the 17 June 2014 is the max Date you will return %KeyDate's 1st June to 17th of June 2014.
What selections do you have in your dashboard?
Have you linked your Calendar to the Fact table via the %KeyDate?
Regards
Richard
- Mark as New
- Bookmark
- Subscribe
- Mute
- Subscribe to RSS Feed
- Permalink
- Report Inappropriate Content
Hello Richard,
Yes, the tables are linked on %KeyDate
What I am trying to achieve is a chart with Day as a dimension and three expressions for MTD, MTD prev month, MTD for the same month last year for a particular month selected and in case a date is selected it should bring back the MTD figures for that day
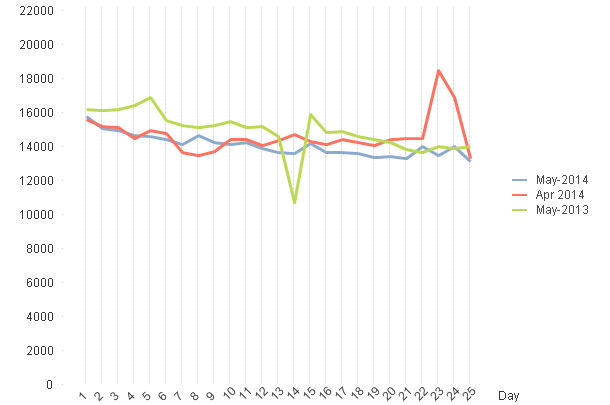
In the above case my selection is May 25th 2014 and it shows the MTD numbers for May 2014, the numbers for April 2014 (comparative period which is 1 - 25th) and for May 2013.
Well, I think that is where my problem lies - in this sample data set I have data only until 7th June. So in this case my expression is failing I guess.
Kindly advise.
Thanks
- Mark as New
- Bookmark
- Subscribe
- Mute
- Subscribe to RSS Feed
- Permalink
- Report Inappropriate Content
Hi Iav
Its a very good use of the calendar!
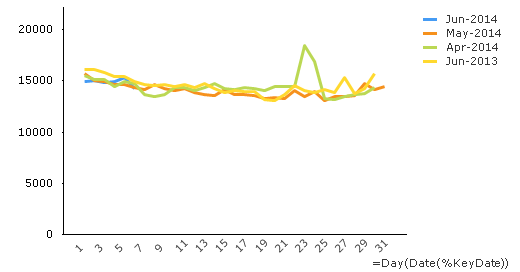
Yes if you haven't got data after June 7th I'd expect your blue line to end on day 7. The other lines would continue until the 17th day (presuming you have a complete history up to the 7th of June).
You could perhaps modify the expression to compensate.
One solution could be to add an additional Date field in your fact table (same format as Date, DD-MMM-YYY) and use RangeMax() on both the fields.
SET a variable
SET vMaxDate = date(rangemax(Date,NewFactDate),'DD-MMM-YYYY');
Expression
num(sum({<Date={'$(=vMaxDate)'},%Flag_ThisMonthToDate={1} >} Sales),'0,000')
Regards
Richard
- Mark as New
- Bookmark
- Subscribe
- Mute
- Subscribe to RSS Feed
- Permalink
- Report Inappropriate Content
Just thought this won't work as it will still get the max date from the calendar.....
The basic principle is correct but the variable needs a re-think. Just popping for lunch so will have a look when I'm back
Rich
- Mark as New
- Bookmark
- Subscribe
- Mute
- Subscribe to RSS Feed
- Permalink
- Report Inappropriate Content
Hello Richard,
Sorry if am sounding dumb - but could you please elaborate this for me so that its a little more clear.
From your post I understand that if I need create a another date in my Fact table - that NewFactDate is essentially the same as creating a field Date as NewFactDate.
so it would translate to
Load
Date,
Date as NewFactDate, .. ... ...
from
my fact qvd;
Then create the vMaxDate variable which chooses the maximum date between Date and NewFactDate.
Assuming All my selections are based on Date field - I choose May 25th 2014
What would be vMaxDate *confused here*
Also, in my fact I have data historically and I don't want the lines going until 17th but as in my previous example only until the day I have chosen.
On an other note, I have multiple fact tables to be used and didn't want to go the way of creating a calendar for each and hence I found your method wonderful. The introduction of weekday/weekend/ holiday flag will be something which I hope to use to awe my business user community.
Thanks for your help in advance.
- Mark as New
- Bookmark
- Subscribe
- Mute
- Subscribe to RSS Feed
- Permalink
- Report Inappropriate Content
Hello,
These extra steps I'm describing are just to resolve your missing data issue. That is if the calendar allows a higher date being selected when there's no corresponding fact data....
In the expression using Date={'$(=max(Date))'} ensures the set analysis is referencing a single date. So if you select the [Month] = May 2014 the max(Date) is 31-May-2014.
Of course you could limit your Calendar QVD load just to %KeyDates that exist in your fact tables using where Exists(%KeyDate) although this may not suit your needs as fact tables may not contain an identical set. For example some may have the 7th June as the most recent and some may have the 16th....
The way I'm describing Is basically ensuring the Date referenced in Set Analysis is never higher than the FACT data
I had a think and if the variable is changed to this it will work:
SET vMaxDate = date(RangeMin(max(Date),max(NewFactDate)),'DD-MMM-YYYY');
Basically we're taking the Max Date from both tables; in our example it would be 17-Jun and 7-Jun from calendar and fact tables respectively and taking the min of both (RangeMin()) which would be the 7-Jun. We now use this date contained in the variable in the expression.
sum({<Date={'$(=vMaxDate)'},%Flag_ThisMonthToDate={1} >} [Your Field to Sum])
Now vMaxDate = 7-Jun-2014 the chart will show three lines until the 7th day for their respective months (if this is the result you were aiming for)
Of course this could be confusing for the user. They have selected the 17th but can only see up to the 7th. You can place objects on the sheet that helps them understand why this is.
If you have different dates in each of your fact tables (such as Sales Date, Invoice Date, Payment Date) this may help http://community.qlik.com/docs/DOC-6502 and can be used in conjunction with this calendar.
I hope this helps
Richard
- Mark as New
- Bookmark
- Subscribe
- Mute
- Subscribe to RSS Feed
- Permalink
- Report Inappropriate Content
Hello Richard,
Thank you very much for the detailed explanation.
I got this working now 
There a few other things I am trying to do - one of which is trying to use this to produce a chart which has daily numbers similar to the above. The above is MTD numbers as you can see for which I use the expression as below.
sum({<Date={'=$(=max(Date))'},%Flag_PreviousMonth_M01={1} >}[My Measure])
If I use the %Flag_IsThisDate - then am able to plot for the chosen month
sum({$<Date={'=$(=max(Date))'},%Flag_IsThisDate={1} >}[My Measure])
But what I would like to achieve is if the month chosen is June 2014, then a daily trend graph as above for the periods of May 2014, April 2014 and June 2013.
Any pointers ?
Thanks,
- « Previous Replies
- Next Replies »