Unlock a world of possibilities! Login now and discover the exclusive benefits awaiting you.
- Qlik Community
- :
- All Forums
- :
- QlikView App Dev
- :
- Re: Split weeks into two datasets if month changes
- Subscribe to RSS Feed
- Mark Topic as New
- Mark Topic as Read
- Float this Topic for Current User
- Bookmark
- Subscribe
- Mute
- Printer Friendly Page
- Mark as New
- Bookmark
- Subscribe
- Mute
- Subscribe to RSS Feed
- Permalink
- Report Inappropriate Content
Split weeks into two datasets if month changes
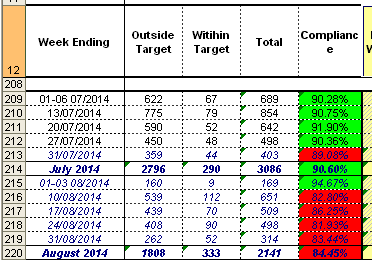
I have a dataset over 6 months which I need to split out into a weekly view. However, when the month changes during the week, I need to be able to show the data up to the end of the month and then for the remainder of the week, for example:
FROM
20-Jul-14 = 642
27-Jul-14 = 498
03-Aug-14 = 572
TO
20-Jul-14 = 642
27-Jul-14 = 498
30-Jul-14 = 403
01 to 03-Aug-14 = 169
I would like to do this in a straight table or pivot table. It must be some combination of the WeekEnd and MonthEnd functions, but I just can't seem to replicate what I need. I have attached an image from the spreadsheet I am trying to replicate
Accepted Solutions
- Mark as New
- Bookmark
- Subscribe
- Mute
- Subscribe to RSS Feed
- Permalink
- Report Inappropriate Content
I managed to solve the issue here, and it turned out to be pretty straightforward. For the Dimension you use the following formula:
IF(Month(Report_Date)<>Month(WeekEnd(Report_Date)),MonthEnd(Report_Date),WeekEnd(Report_Date))
In summary; if the month of the date is not the same as the month of the last day of the week, then bring back the end of the month otherwise bring back the end of the week
I'm not really sure why the month part did not occur to me beforehand, but there you go!
- Mark as New
- Bookmark
- Subscribe
- Mute
- Subscribe to RSS Feed
- Permalink
- Report Inappropriate Content
Hi,
In the attaced file you have an example with Month and Week as you need
Is in Spanish
- Week = Semana
- Month = Mes
Saludos y suerte
Enrique
- Mark as New
- Bookmark
- Subscribe
- Mute
- Subscribe to RSS Feed
- Permalink
- Report Inappropriate Content
Thanks for that, I have split the data out by month in the table as well as week to show the totals as in the spreadsheet picture. I still need to display the week name as two different things though
- Mark as New
- Bookmark
- Subscribe
- Mute
- Subscribe to RSS Feed
- Permalink
- Report Inappropriate Content
I managed to solve the issue here, and it turned out to be pretty straightforward. For the Dimension you use the following formula:
IF(Month(Report_Date)<>Month(WeekEnd(Report_Date)),MonthEnd(Report_Date),WeekEnd(Report_Date))
In summary; if the month of the date is not the same as the month of the last day of the week, then bring back the end of the month otherwise bring back the end of the week
I'm not really sure why the month part did not occur to me beforehand, but there you go!