Unlock a world of possibilities! Login now and discover the exclusive benefits awaiting you.
- Qlik Community
- :
- All Forums
- :
- QlikView Administration
- :
- Change color schema in stacked bars
- Subscribe to RSS Feed
- Mark Topic as New
- Mark Topic as Read
- Float this Topic for Current User
- Bookmark
- Subscribe
- Mute
- Printer Friendly Page
- Mark as New
- Bookmark
- Subscribe
- Mute
- Subscribe to RSS Feed
- Permalink
- Report Inappropriate Content
Change color schema in stacked bars
Hi,
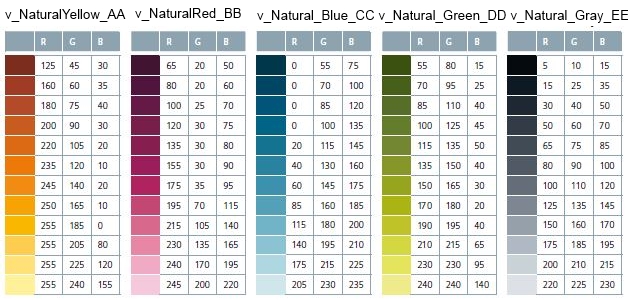
charts in QlikView have a default color schema on stacked bars. I will change this color set with my own. In a listbox there are five entrys (AA, BB, CC, DD, EE) which should have fixed color. Click on AA will be open the next level (AA1, AA2). Now this level should have same color spectrum before. Can I also calculate the color below AA? Pls see color spectrum in attached pic.
AA: v_NaturalYellow_AA = RGB(235,120,10);
AA1: v_NaturalYellow_AA1 = RGB(245,140,20);
AA2: v_NaturalYellow_AA2 = RGB(225,185,0);
...
BB: v_NaturalRed_BB = RGB(100,25,70);
BB1:
BB2:
...
CC: v_Natural_Blue_CC = RGB(0,100,135)
CC1:
CC2:
...
DD: v_Natural_Green_DD = RGB(100,125,45)
DD1:
DD2:
...
EE: v_Natural_Gray_EE = RGB(80,90,100)
EE1:
EE2:
...
- Tags:
- qlikview_publisher
- Mark as New
- Bookmark
- Subscribe
- Mute
- Subscribe to RSS Feed
- Permalink
- Report Inappropriate Content
Hi Stefan,
you can use any kind of formula to calculate RGB() colours in the formula_properties (on the "formula" tab of the dialog, just expand any of your formulas by clicking on the little cross - you can also make it dependent on the last selection by using the >> Getcurrentselections() << function
HTH
Best regards,
DataNibbler