Unlock a world of possibilities! Login now and discover the exclusive benefits awaiting you.
- Qlik Community
- :
- All Forums
- :
- QlikView App Dev
- :
- Creating a Total Column
- Subscribe to RSS Feed
- Mark Topic as New
- Mark Topic as Read
- Float this Topic for Current User
- Bookmark
- Subscribe
- Mute
- Printer Friendly Page
- Mark as New
- Bookmark
- Subscribe
- Mute
- Subscribe to RSS Feed
- Permalink
- Report Inappropriate Content
Creating a Total Column
Hi
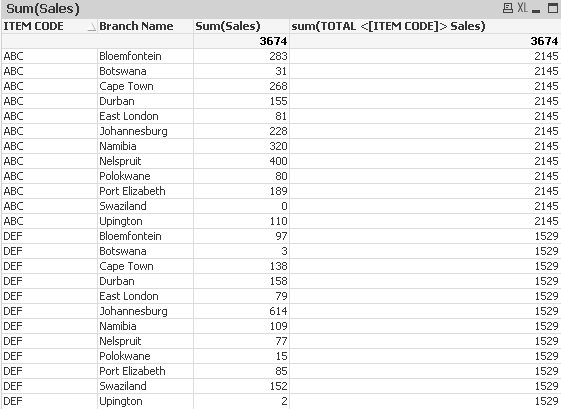
I have a sample of a straight table. (see below). Sales per item per Branch.
I want to create a total column per item ( ie i want to create the column highlighted in yellow).
How do I do this.
kind regards
Nayan
| ITEM CODE | Branch Name | Sales | Total Sales per Item |
| ABC | Bloemfontein | 283 | 2,145 |
| ABC | Botswana | 31 | 2,145 |
| ABC | Cape Town | 268 | 2,145 |
| ABC | Durban | 155 | 2,145 |
| ABC | East London | 81 | 2,145 |
| ABC | Johannesburg | 228 | 2,145 |
| ABC | Namibia | 320 | 2,145 |
| ABC | Nelspruit | 400 | 2,145 |
| ABC | Polokwane | 80 | 2,145 |
| ABC | Port Elizabeth | 189 | 2,145 |
| ABC | Swaziland | 0 | 2,145 |
| ABC | Upington | 110 | 2,145 |
| ABC | Total | 2,145 | 2,145 |
| DEF | Bloemfontein | 97 | 1,529 |
| DEF | Botswana | 3 | 1,529 |
| DEF | Cape Town | 138 | 1,529 |
| DEF | Durban | 158 | 1,529 |
| DEF | East London | 79 | 1,529 |
| DEF | Johannesburg | 614 | 1,529 |
| DEF | Namibia | 109 | 1,529 |
| DEF | Nelspruit | 77 | 1,529 |
| DEF | Polokwane | 15 | 1,529 |
| DEF | Port Elizabeth | 85 | 1,529 |
| DEF | Swaziland | 152 | 1,529 |
| DEF | Upington | 2 | 1,529 |
| DEF | Total | 1,529 | 1,529 |
| 3,674 | 1,529 |
- Tags:
- qlikview_scripting
- « Previous Replies
-
- 1
- 2
- Next Replies »
Accepted Solutions
- Mark as New
- Bookmark
- Subscribe
- Mute
- Subscribe to RSS Feed
- Permalink
- Report Inappropriate Content
If(IsNull(Aggr(SUM( {<[MonthIndex]={'$(vMaxMIMinus6)'}>}[Sales Quantity])
+
SUM( {<[MonthIndex]={'$(vMaxMIMinus5)'}>}[Sales Quantity])
+
SUM( {<[MonthIndex]={'$(vMaxMIMinus4)'}>}[Sales Quantity])
+
SUM( {<[MonthIndex]={'$(vMaxMIMinus3)'}>}[Sales Quantity])
+
SUM( {<[MonthIndex]={'$(vMaxMIMinus2)'}>}[Sales Quantity])
+
SUM( {<[MonthIndex]={'$(vMaxMIMinus1)'}>}[Sales Quantity]),[Item Code])/ 6
),Above(Column(9),1,1),Aggr(SUM( {<[MonthIndex]={'$(vMaxMIMinus6)'}>}[Sales Quantity])
+
SUM( {<[MonthIndex]={'$(vMaxMIMinus5)'}>}[Sales Quantity])
+
SUM( {<[MonthIndex]={'$(vMaxMIMinus4)'}>}[Sales Quantity])
+
SUM( {<[MonthIndex]={'$(vMaxMIMinus3)'}>}[Sales Quantity])
+
SUM( {<[MonthIndex]={'$(vMaxMIMinus2)'}>}[Sales Quantity])
+
SUM( {<[MonthIndex]={'$(vMaxMIMinus1)'}>}[Sales Quantity]),[Item Code])/ 6
)
- Mark as New
- Bookmark
- Subscribe
- Mute
- Subscribe to RSS Feed
- Permalink
- Report Inappropriate Content
=Aggr(Sum(Sales),[ITEM CODE])
- Mark as New
- Bookmark
- Subscribe
- Mute
- Subscribe to RSS Feed
- Permalink
- Report Inappropriate Content
or you can use
=sum(TOTAL <[ITEM CODE]> Sales)
- Mark as New
- Bookmark
- Subscribe
- Mute
- Subscribe to RSS Feed
- Permalink
- Report Inappropriate Content
Another way if you add the Sum fields in the load script
Tab1:
LOAD [ITEM CODE], [Branch Name], Sales, [Total Sales per Item];
LOAD * INLINE [
ITEM CODE, Branch Name, Sales, Total Sales per Item
ABC, Bloemfontein, 283, 2145
ABC, Botswana, 31, 2145
ABC, Cape Town, 268, 2145
ABC, Durban, 155, 2145
ABC, East London, 81, 2145
ABC, Johannesburg, 228, 2145
ABC, Namibia, 320, 2145
ABC, Nelspruit, 400, 2145
ABC, Polokwane, 80, 2145
ABC, Port Elizabeth, 189, 2145
ABC, Swaziland, 0, 2145
ABC, Upington, 110, 2145
DEF, Bloemfontein, 97, 1529
DEF, Botswana, 3, 1529
DEF, Cape Town, 138, 1529
DEF, Durban, 158, 1529
DEF, East London, 79, 1529
DEF, Johannesburg, 614, 1529
DEF, Namibia, 109, 1529
DEF, Nelspruit, 77, 1529
DEF, Polokwane, 15, 1529
DEF, Port Elizabeth, 85, 1529
DEF, Swaziland, 152, 1529
DEF, Upington, 2, 1529
];
Left Join
LOAD
[ITEM CODE],
sum( Sales) as [Total Sum] //For Total Sum
Resident Tab1 Group By [ITEM CODE];
And then in chart
Dim1:-[ITEM CODE], [Branch Name]
Expre:- Sum(Sales)
Expre:- [Total Sum]
Or simple in the front end
Sum(Sales)
Sum(TOTAL <[ITEM CODE]> Sales)
Regards
Anand
- Mark as New
- Bookmark
- Subscribe
- Mute
- Subscribe to RSS Feed
- Permalink
- Report Inappropriate Content
Hi All
I send the post before I went home last night, hence the delayed reply. Thank you for your responses. Will try the scripting and let you know .
kind regards
Nayan
- Mark as New
- Bookmark
- Subscribe
- Mute
- Subscribe to RSS Feed
- Permalink
- Report Inappropriate Content
Hi Anbu
I've tried the formula , however it gives the grand total. ie 3674 for ABC & DEF. I require for ABC the total to show 2145 and for DEF to show 1529.
kind regards
Nayan
- Mark as New
- Bookmark
- Subscribe
- Mute
- Subscribe to RSS Feed
- Permalink
- Report Inappropriate Content
Check the attached app
Dimension: ITEM CODE,Branch Name
Expression: Aggr(Sum(Sales),[ITEM CODE])
- Mark as New
- Bookmark
- Subscribe
- Mute
- Subscribe to RSS Feed
- Permalink
- Report Inappropriate Content
Hi Anbu
In my QV Model, my Sales is a calculated field. How do I apply your formula. It works if it is a proper field from the loading script. However it does not work as mines on the front end is a calculated field.
kind regards
Nayan
- Mark as New
- Bookmark
- Subscribe
- Mute
- Subscribe to RSS Feed
- Permalink
- Report Inappropriate Content
Can you post sample app
- Mark as New
- Bookmark
- Subscribe
- Mute
- Subscribe to RSS Feed
- Permalink
- Report Inappropriate Content
Hi Anbu
Will compile a sample model for you. I'll create a mock database in excel and link the QV Model to it.
kind regards
Nayan
- « Previous Replies
-
- 1
- 2
- Next Replies »