Unlock a world of possibilities! Login now and discover the exclusive benefits awaiting you.
- Qlik Community
- :
- All Forums
- :
- QlikView App Dev
- :
- Re: Chart Question
- Subscribe to RSS Feed
- Mark Topic as New
- Mark Topic as Read
- Float this Topic for Current User
- Bookmark
- Subscribe
- Mute
- Printer Friendly Page
- Mark as New
- Bookmark
- Subscribe
- Mute
- Subscribe to RSS Feed
- Permalink
- Report Inappropriate Content
Chart Question
I have the following list box:

I have the following chart:
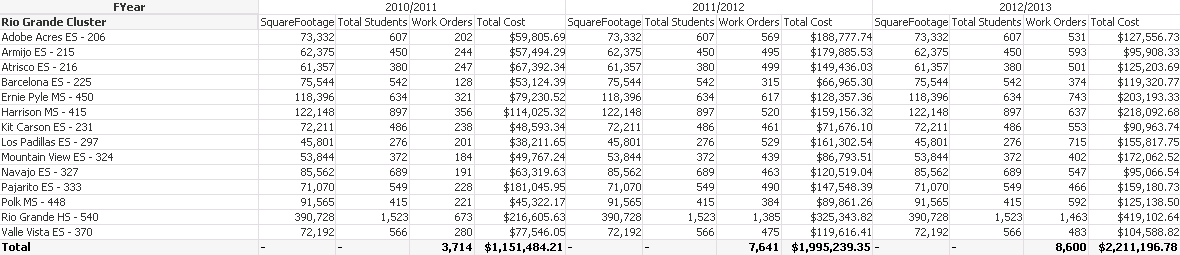
The results I am looking for is to drop the list box and have a separate chart for each of the clusters. Is that possible? I know that if I select different items in the list box the chart values change but I dont want that.
Thanks,
David
- Tags:
- qlikview_scripting
Accepted Solutions
- Mark as New
- Bookmark
- Subscribe
- Mute
- Subscribe to RSS Feed
- Permalink
- Report Inappropriate Content
Yes thats possible. In the expressions you can use hardcoded Set analysis.
Example
Sum(<{Cluster={'Rio'}}>Cost) This would be for first chart for Cluster Rio.
Sum(<{Cluster={'West Mesa'}}>Cost) This would be for second chart for Cluster West Mesa and so on.....
Thanks
- Mark as New
- Bookmark
- Subscribe
- Mute
- Subscribe to RSS Feed
- Permalink
- Report Inappropriate Content
Thank you Ajay. I tried your example before I asked the question and it did not work. I see now where I went wrong.