Unlock a world of possibilities! Login now and discover the exclusive benefits awaiting you.
- Qlik Community
- :
- All Forums
- :
- QlikView Administration
- :
- Re: Do While loop in script for monthy totals
- Subscribe to RSS Feed
- Mark Topic as New
- Mark Topic as Read
- Float this Topic for Current User
- Bookmark
- Subscribe
- Mute
- Printer Friendly Page
- Mark as New
- Bookmark
- Subscribe
- Mute
- Subscribe to RSS Feed
- Permalink
- Report Inappropriate Content
Do While loop in script for monthy totals
Hi
Not sure where to start on this one.
Want to end up with the straight Table examples 1 and 2, but with the data calculated in the Script.
| Straight Table example 1 ID - A | |||||||
| 14-01 | 14-02 | 14-03 | 14-04 | 14-05 | 14-06 | Total | |
| Planned Hours | 5 | 10 | 10 | 15 | 10 | 10 | 60 |
| Actual Hours | 10 | 15 | 12 | 37 | |||
| Remaining Hours | 3 | 10 | 10 | 23 | |||
| Straight Table example 2 ID - B | |||||||
| 14-11 | 14-12 | 15-01 | 15-02 | 15-03 | Total | ||
| Planned Hours | 100 | 200 | 200 | 200 | 200 | 900 | |
| Actual Hours | 250 | 250 | |||||
| Remaining Hours | 50 | 200 | 200 | 200 | 650 | ||
Have Tasks and Resource which is combined into a ID as per ID - A and ID - B
For each ID there are Planned hours per Year-Month to complete the Task & Actual hours they have booked against the task per Year Month
What I need to calculate in the script is the Remaining Planned hours per Year – Month for each ID.
The remaining Planned hours per month cannot be greater than originally planned hours per Month.
As I start off with 5 million rows of raw data as it is stored in days in or ERP system. I have summed this up into a number of tables; the main ones I would use would be Planned Monthly Table and Actual Total Table as shown.
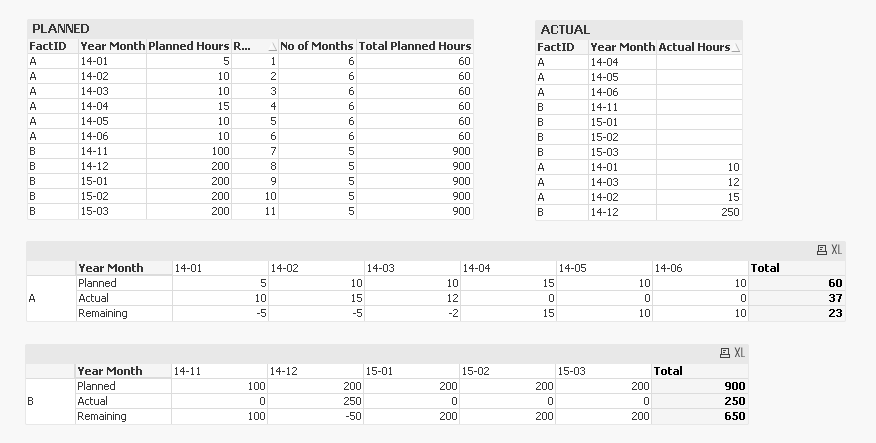
The Planned Monthly Table is sorted by ID and Year Month and has Row No, Total No Months and Total Planned hours.
| Planned Monthly Table | |||||
| ID | Year Month | Planned Hours | Row No | No of Months | Total Planned Hours |
| A | 14-01 | 5 | 1 | 6 | 60 |
| A | 14-02 | 10 | 2 | 6 | 60 |
| A | 14-03 | 10 | 3 | 6 | 60 |
| A | 14-04 | 15 | 4 | 6 | 60 |
| A | 14-05 | 10 | 5 | 6 | 60 |
| A | 14-06 | 10 | 6 | 6 | 60 |
| B | 14-11 | 100 | 7 | 5 | 900 |
| B | 14-12 | 200 | 8 | 5 | 900 |
| B | 15-01 | 200 | 9 | 5 | 900 |
| B | 15-02 | 200 | 10 | 5 | 900 |
| B | 15-03 | 200 | 11 | 5 | 900 |
The Actual Total Table just has the ID and the Total Actual Hours. There are other detailed tables but didn’t think they would be wanted demonstrate this example.
| Actual Total Table | |
| ID | Total Actual |
| A | 37 |
| B | 250 |
My thoughts were to calculate the delta between Total Planned and Total Actual (A = 23) (B = 650)
Then loop through each Month starting at the last month deducting the planned hours from the remaining hours, until the remaining hours are zero, then loop to the next ID. Some ID’s could be over 120 months (10 Years)
A = 23 – 10 = 13
13 – 10 = 3
3
B = 650 – 200 = 450
450 – 200 = 250
250 – 200 = 50
50
Sometimes the Actual > than planned so I would filter the table first so I don’t have to loop these then combine them later.
Hope all this makes sense I know this isn’t a 5 minute answer but need some help putting the loop together and moving form 1 ID to the next. So any help would be much appreciated.
Thanks
Mark
- « Previous Replies
-
- 1
- 2
- Next Replies »
- Mark as New
- Bookmark
- Subscribe
- Mute
- Subscribe to RSS Feed
- Permalink
- Report Inappropriate Content
Hi Mark,
I don't understand how to calculate Actual Hours (i.e. values 10, 15, 12 in 14-01, 14-02 and 14-03 in first table shown).
Furthermore, it would be very helpfull if you showed the expected result (such as the final table).
Thanks
- Mark as New
- Bookmark
- Subscribe
- Mute
- Subscribe to RSS Feed
- Permalink
- Report Inappropriate Content
HI Elena
Thanks for you're interest the Actual hours are known facts it's the remaining hours are ones to be calculated, I will upload the expected result in the morning.
- Mark as New
- Bookmark
- Subscribe
- Mute
- Subscribe to RSS Feed
- Permalink
- Report Inappropriate Content
I couldn't help thinking that the solution is much easier to come up with using Pivot Table so I made a solution not solving the entire transformation in the Load Script. Anyhow several things had to be done in the Load Script to get the proper data model for a Pivot Table.A pure Load Script solution will get up to 120 months as columns ... which is hardly optimal for a QlikView data model...The proposed solution gives you tremendously more flexibility as you can dynamically include or exclude columns from the pivot only by selecting from a listbox for [Year Month].
- Mark as New
- Bookmark
- Subscribe
- Mute
- Subscribe to RSS Feed
- Permalink
- Report Inappropriate Content
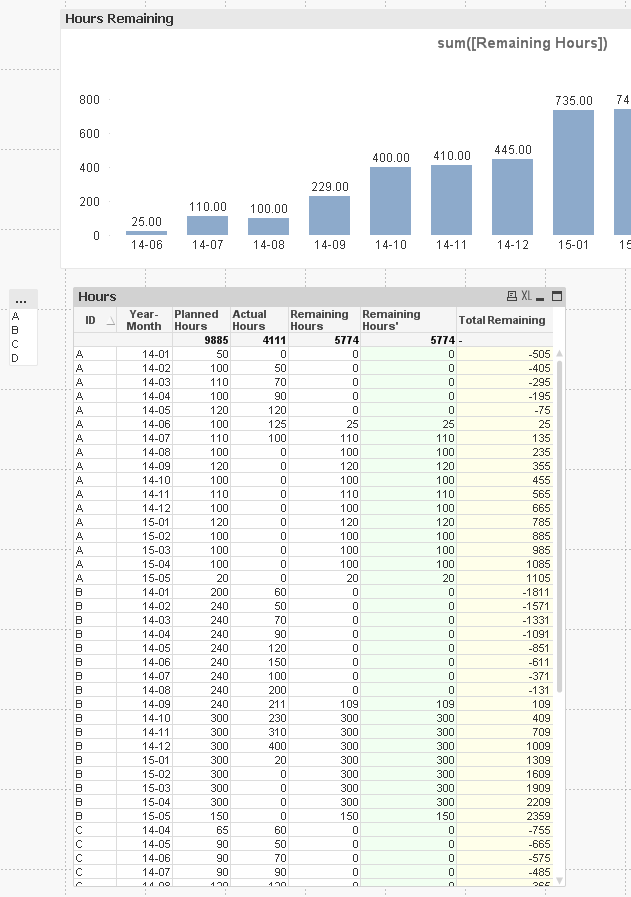
Hi thanks for your various replies please find enclosed my expected results, in bar graph showing the remaining hours.
The important thing I need the Remaining Hours to be calculated.
This calculation is based on the following that needs to be in some sort of loop for each ID working backwards from the last month.
E.g Total Planned – Total Actual = X and Last Month = Dec
Then if X > Planned Hours of Dec, Dec Remaining Hours = Planned Hours and X = X –Planned Hours,
Then if X > Planned Hours Nov, Nov Remaining Hours = Planned Hours and X = X – Planned Hours,
And so on until
Else Remaining hours = Planned Hours – X
Then when X = 0 Loop to the next ID.
Hope this makes sense.
Thanks
Mark
- Mark as New
- Bookmark
- Subscribe
- Mute
- Subscribe to RSS Feed
- Permalink
- Report Inappropriate Content
I am sorry ... It doesn't make any sense to me. Your explanation of how to calculate I mean.
Tell me do you want to have this all calculated in the load script? If yes - why?
If you want some more help I will have to ask you to give me an example of a real calculation in a spreadsheet that works. Then I will be able to replicate it in QlikView without spending a lot of time trying to understand any explanations...
- Mark as New
- Bookmark
- Subscribe
- Mute
- Subscribe to RSS Feed
- Permalink
- Report Inappropriate Content
HI Petter
My reason for calculating in the load script is because my real data is 5,000,000 plus rows as the info comes from an ERP system and I though it would be more efficient To do the calculation in the script.
I would also struggle to do the loop calculation in Excel.
I realise my explanation is difficult to understand, but if you see my original posting the result of the remaining hours might make more sense.
Basiclly if the total Actual Hours are less that the total planned hours Then the remaining monthly hours can only be the samed as the original planned hours per month except the 1st month with remaining hours could be less. So total Remaining hours + Total Actual hours = Total Planned Hours.
- Mark as New
- Bookmark
- Subscribe
- Mute
- Subscribe to RSS Feed
- Permalink
- Report Inappropriate Content
Well - after having studied your description and your test data I managed to understand the logic of it. Actually 5 million rows is no match for QlikView so I would go for the in-memory calculation approach instead of a Load Script calculation.A load script approach should actually also be quite straight-forward I think (but I will not cover that here). I would advise you to have a data model with all both Planned and Actual Hours in the same table which will speed up calculation too.
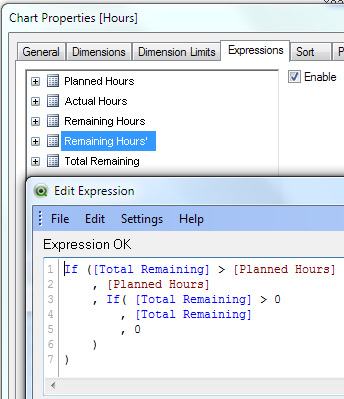
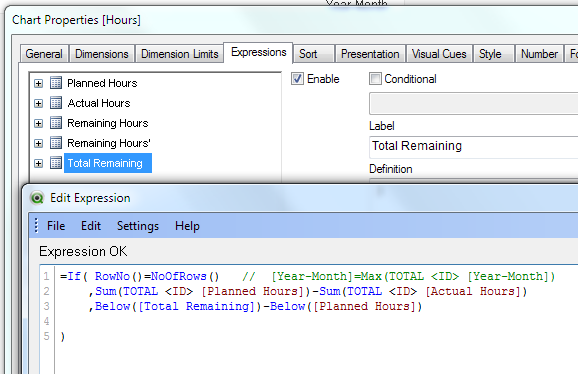
The final expressions turned out to be rather straight forward:
- Mark as New
- Bookmark
- Subscribe
- Mute
- Subscribe to RSS Feed
- Permalink
- Report Inappropriate Content
Thanks Petter thats a great help a lot more simpler than I thought.
Just looking at combining Remaining Hours' and Total Hours into one expression as I only want to display the Remaining Hours in the bar Chart.
- Mark as New
- Bookmark
- Subscribe
- Mute
- Subscribe to RSS Feed
- Permalink
- Report Inappropriate Content
You can just hide the column - it is probably much better performance wise instead of repeating the calculation three times while embedding it into a single expression....
- « Previous Replies
-
- 1
- 2
- Next Replies »