Unlock a world of possibilities! Login now and discover the exclusive benefits awaiting you.
- Qlik Community
- :
- All Forums
- :
- QlikView App Dev
- :
- Image as a representation of dimension in a chart
- Subscribe to RSS Feed
- Mark Topic as New
- Mark Topic as Read
- Float this Topic for Current User
- Bookmark
- Subscribe
- Mute
- Printer Friendly Page
- Mark as New
- Bookmark
- Subscribe
- Mute
- Subscribe to RSS Feed
- Permalink
- Report Inappropriate Content
Image as a representation of dimension in a chart
Dear All,
Is this possible to use an image as a representation of dimension in a chart?
For example, I want to create a line chart showing sale of sweets in time. There are 2 categories of sweets: chocolate and cakes, so there are 2 lines on chart - one represents chocolate and the other one cakes. (example attached)
Instead of words "Cakes" and "Chocolate" I want to see some pictures with cakes and chocolate in the legend.
Does anybody know if it is possible in QlikView?
I would be grateful for your help..
Regards,
Bartłomiej
- Mark as New
- Bookmark
- Subscribe
- Mute
- Subscribe to RSS Feed
- Permalink
- Report Inappropriate Content
In a line chart is not possible, in a table (pivot or straight yes)
Hope it helpès
- Mark as New
- Bookmark
- Subscribe
- Mute
- Subscribe to RSS Feed
- Permalink
- Report Inappropriate Content
Hi,
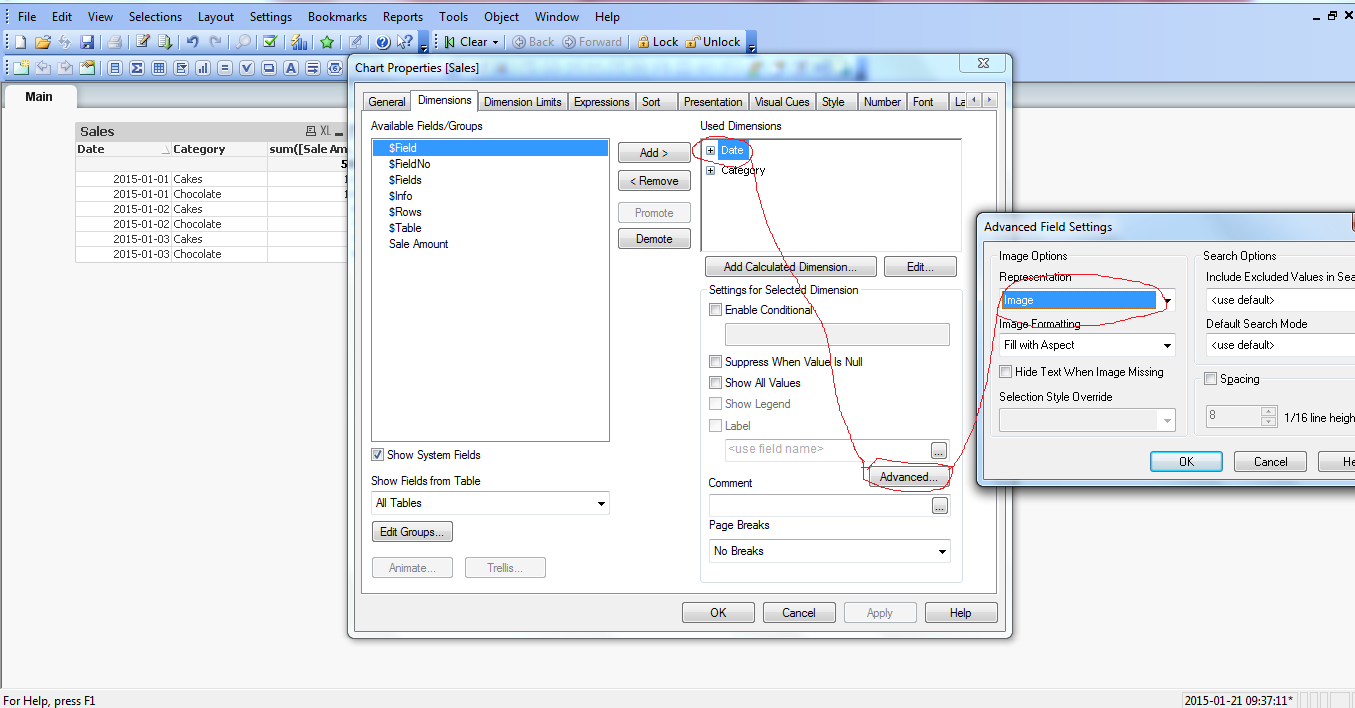
Image representation is possible with only pivot table & Straight table
Image representation is not possible with other charts...
For more please find the attached image u can get the Idea
- Mark as New
- Bookmark
- Subscribe
- Mute
- Subscribe to RSS Feed
- Permalink
- Report Inappropriate Content
As per my Knowledge You connot have image as a dimension. One work around would be loading the table using bundle info load and using the field in expression with info().
try with the attached document
- Mark as New
- Bookmark
- Subscribe
- Mute
- Subscribe to RSS Feed
- Permalink
- Report Inappropriate Content
Thanks, your post is very useful.
Hi Adriano
- Mark as New
- Bookmark
- Subscribe
- Mute
- Subscribe to RSS Feed
- Permalink
- Report Inappropriate Content
Can you explain the chart step by step , I can the image as expression not dimension. Why you have added
Alabet in dimension & its not visible in chart.
Hard to understand
- Mark as New
- Bookmark
- Subscribe
- Mute
- Subscribe to RSS Feed
- Permalink
- Report Inappropriate Content
Shweta,
You can have a budle load of the dimensions. Please go through the thread and know how it works.
- Mark as New
- Bookmark
- Subscribe
- Mute
- Subscribe to RSS Feed
- Permalink
- Report Inappropriate Content
You can add the dimension images as below
Let you have a dimension Product Type. Now load a budle images in the script and map it with different Product Type.
Now use the Product Type as dimension and at dimension+ symbol you can call the budle values as bachground. It may work.
- Mark as New
- Bookmark
- Subscribe
- Mute
- Subscribe to RSS Feed
- Permalink
- Report Inappropriate Content
No that different