Unlock a world of possibilities! Login now and discover the exclusive benefits awaiting you.
Announcements
Qlik Connect 2025: 3 days of full immersion in data, analytics, and AI. May 13-15 | Orlando, FL:
Learn More
- Qlik Community
- :
- All Forums
- :
- QlikView App Dev
- :
- Re: Reposition Pie Chart data point values?
Options
- Subscribe to RSS Feed
- Mark Topic as New
- Mark Topic as Read
- Float this Topic for Current User
- Bookmark
- Subscribe
- Mute
- Printer Friendly Page
Turn on suggestions
Auto-suggest helps you quickly narrow down your search results by suggesting possible matches as you type.
Showing results for
Not applicable
2014-03-04
03:31 PM
- Mark as New
- Bookmark
- Subscribe
- Mute
- Subscribe to RSS Feed
- Permalink
- Report Inappropriate Content
Reposition Pie Chart data point values?
Hi community,
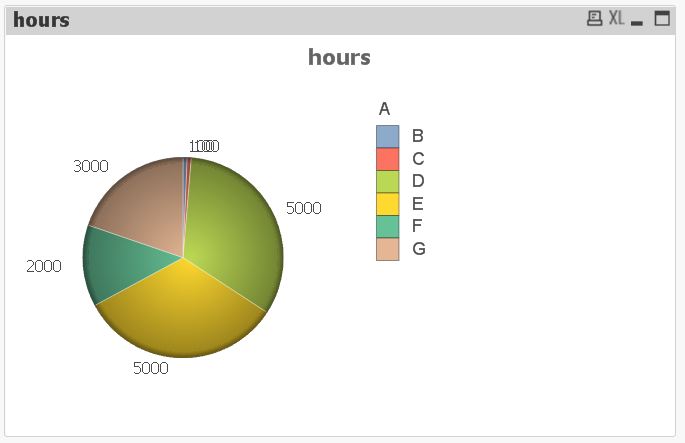
How do we reposition a Pie Chart data point value so that they are more readable?
In the example below, it is hard to read the data values on the blue and red slices. I want to reposition the numbers and not just decrease the font.
Thanks!
- « Previous Replies
-
- 1
- 2
- Next Replies »
13 Replies
Partner - Creator II
2014-03-04
05:47 PM
- Mark as New
- Bookmark
- Subscribe
- Mute
- Subscribe to RSS Feed
- Permalink
- Report Inappropriate Content
Nice! You could actually skip chr(13) and only keep chr(10) for the same result.
Email: christian.lauritzen@b3.se
370 Views
Specialist III
2015-01-28
04:12 AM
- Mark as New
- Bookmark
- Subscribe
- Mute
- Subscribe to RSS Feed
- Permalink
- Report Inappropriate Content
can you give some steps how to use google charts in qlikview app like
how to pass the dimension, measures etc.
Thanks
370 Views
Specialist III
2015-01-28
04:12 AM
- Mark as New
- Bookmark
- Subscribe
- Mute
- Subscribe to RSS Feed
- Permalink
- Report Inappropriate Content
can you give some steps how to use google charts in qlikview app like
how to pass the dimension, measures etc.
Thanks
370 Views
Anonymous
Not applicable
2015-02-02
11:15 AM
Author
- Mark as New
- Bookmark
- Subscribe
- Mute
- Subscribe to RSS Feed
- Permalink
- Report Inappropriate Content
370 Views
- « Previous Replies
-
- 1
- 2
- Next Replies »