Unlock a world of possibilities! Login now and discover the exclusive benefits awaiting you.
- Qlik Community
- :
- All Forums
- :
- QlikView App Dev
- :
- Re: How to use a Linear gauge
- Subscribe to RSS Feed
- Mark Topic as New
- Mark Topic as Read
- Float this Topic for Current User
- Bookmark
- Subscribe
- Mute
- Printer Friendly Page
- Mark as New
- Bookmark
- Subscribe
- Mute
- Subscribe to RSS Feed
- Permalink
- Report Inappropriate Content
How to use a Linear gauge
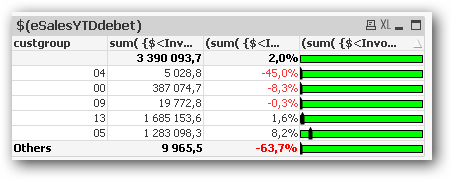
How do I get this linear gauge divided in three parts,red,yellow and green. The boundries should be < -1% to -100% for red,
-0,9% to 0,9% for yellow and >=1,0% for green. Can it be a problem that I have tha calculation in an variable?
The value in the linear gauge is the same value as the percentage value in the table.
kindly
Håkan 
Accepted Solutions
- Mark as New
- Bookmark
- Subscribe
- Mute
- Subscribe to RSS Feed
- Permalink
- Report Inappropriate Content
Hi
Goto Expressions tab-> Choose your Expression->then Representation-> Select Linear Gauge->GotobGauge Settings ->At the gauge settings,Give your min and max value.Then, Add Segment-> For Each Segment ,give value at Lower Bound.For eg; segment1->Lower Bound Value 0.
Segment 2 -> Lower Bound Value 50
Segment 3 -> Lower Bound value 95
Choose colors as per your requirement.
Regards
Krishna
- Mark as New
- Bookmark
- Subscribe
- Mute
- Subscribe to RSS Feed
- Permalink
- Report Inappropriate Content
Hi,
PFA ,
It helps you.
Regards
Krishna
- Mark as New
- Bookmark
- Subscribe
- Mute
- Subscribe to RSS Feed
- Permalink
- Report Inappropriate Content
Hi
On the chart properties | expression tab, click Gauge Settings. On this dialog you can set minimum and maximum values for the gauge, and you can set up the segments and colours. To manually set the segment boundaries, turn off the checkbox "Autowidth Segments" and enter the lower bounds for each segment.
HTH
Jonathan
- Mark as New
- Bookmark
- Subscribe
- Mute
- Subscribe to RSS Feed
- Permalink
- Report Inappropriate Content
Hi
Goto Expressions tab-> Choose your Expression->then Representation-> Select Linear Gauge->GotobGauge Settings ->At the gauge settings,Give your min and max value.Then, Add Segment-> For Each Segment ,give value at Lower Bound.For eg; segment1->Lower Bound Value 0.
Segment 2 -> Lower Bound Value 50
Segment 3 -> Lower Bound value 95
Choose colors as per your requirement.
Regards
Krishna
- Mark as New
- Bookmark
- Subscribe
- Mute
- Subscribe to RSS Feed
- Permalink
- Report Inappropriate Content
Hello again,
I cannot get this working. I have made a small program with data.
Can someone change so I can get the result as described in my question?
kindly
Håkan
- Mark as New
- Bookmark
- Subscribe
- Mute
- Subscribe to RSS Feed
- Permalink
- Report Inappropriate Content
Hello all,
I have now solved the problem. Thanks for all help.
kindly
Håkan