Unlock a world of possibilities! Login now and discover the exclusive benefits awaiting you.
- Qlik Community
- :
- All Forums
- :
- QlikView App Dev
- :
- Re: How to display charts with button?
- Subscribe to RSS Feed
- Mark Topic as New
- Mark Topic as Read
- Float this Topic for Current User
- Bookmark
- Subscribe
- Mute
- Printer Friendly Page
- Mark as New
- Bookmark
- Subscribe
- Mute
- Subscribe to RSS Feed
- Permalink
- Report Inappropriate Content
How to display charts with button?
hi ,
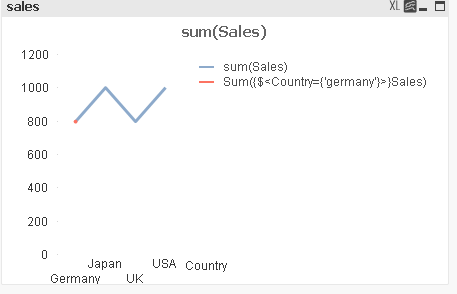
I displayed bar chart with button. and I try to display another line chart with button.when I try to display line chart with button this not work to me.I want to display another chart with button.pls tell me out how to display line chart with button.I attached images below this mail .pls solve my problem.I want to display like this my chart If i click my button the chart displayed and click again my button the chart hide .i want to do this pls help me.
Thank you,
Regards
Madhu.
- « Previous Replies
-
- 1
- 2
- Next Replies »
- Mark as New
- Bookmark
- Subscribe
- Mute
- Subscribe to RSS Feed
- Permalink
- Report Inappropriate Content
Hi.
1.create variable vShowchart and value is sales click ok.
2.go to chart properties Layout tab conditional textbox give to vShowchart='sales' in the first chart.
3.create button object after action properties set variable and variable vShowchart, value is sales.
4.sheet object to create textbox object to select vShowchart varible click ok.
important while using charts Layout tab conditional textbox give to vShowchart='order' like that give to your expressions.
try once ..
Thanks,
Sreenu
- Mark as New
- Bookmark
- Subscribe
- Mute
- Subscribe to RSS Feed
- Permalink
- Report Inappropriate Content
Thank you hari prasad it is working
- Mark as New
- Bookmark
- Subscribe
- Mute
- Subscribe to RSS Feed
- Permalink
- Report Inappropriate Content
Thankyou sreenu v
- « Previous Replies
-
- 1
- 2
- Next Replies »