Unlock a world of possibilities! Login now and discover the exclusive benefits awaiting you.
- Qlik Community
- :
- All Forums
- :
- QlikView App Dev
- :
- Re: Dynamic colors in speedometer segments
- Subscribe to RSS Feed
- Mark Topic as New
- Mark Topic as Read
- Float this Topic for Current User
- Bookmark
- Subscribe
- Mute
- Printer Friendly Page
- Mark as New
- Bookmark
- Subscribe
- Mute
- Subscribe to RSS Feed
- Permalink
- Report Inappropriate Content
Dynamic colors in speedometer segments
Hello,
we have a speedometer graphic with the 3 classic segments (red, yellow, green).
We set the boundaries in this way:
- red (current result is worse than previous year)
- yellow (better than previous year)
- green (over target)
Values of segments are fixed as simple numbers.
But if we select some months or quarters or other products filters, of course the needle moves but boundaries are not referred to that month or that product. They obviously remain set for whole year result.
How can we set dynamic segment colors? Is it possible with some expressions?
Thanks.
- Mark as New
- Bookmark
- Subscribe
- Mute
- Subscribe to RSS Feed
- Permalink
- Report Inappropriate Content
You can use expressions in stead of fixed values for the segment boundaries.
talk is cheap, supply exceeds demand
- Mark as New
- Bookmark
- Subscribe
- Mute
- Subscribe to RSS Feed
- Permalink
- Report Inappropriate Content
How to use experession..
- Mark as New
- Bookmark
- Subscribe
- Mute
- Subscribe to RSS Feed
- Permalink
- Report Inappropriate Content
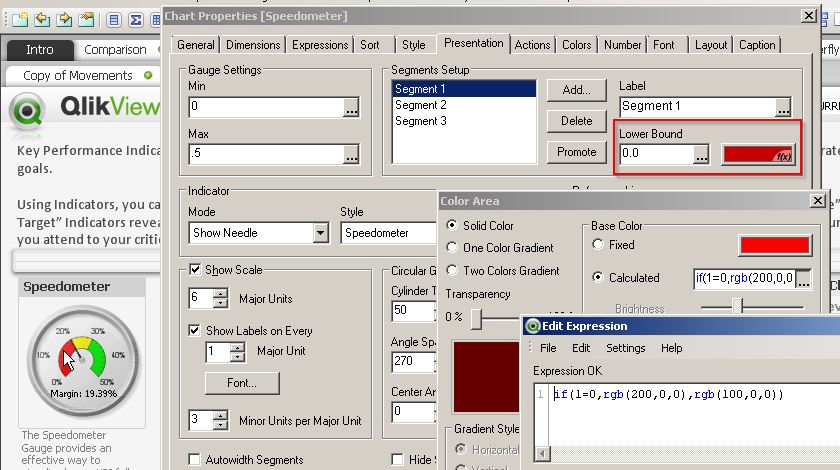
you can change (red rectangle)
- bound
- color
for every segment
In image an example with an expression (replace 1=0, ...) for color
- Mark as New
- Bookmark
- Subscribe
- Mute
- Subscribe to RSS Feed
- Permalink
- Report Inappropriate Content
Thanks Massimo.
It was helpful 
Regards,
Kuldeep