Unlock a world of possibilities! Login now and discover the exclusive benefits awaiting you.
- Qlik Community
- :
- All Forums
- :
- QlikView App Dev
- :
- Re: Make an Excel-file for showing budget in a bar...
- Subscribe to RSS Feed
- Mark Topic as New
- Mark Topic as Read
- Float this Topic for Current User
- Bookmark
- Subscribe
- Mute
- Printer Friendly Page
- Mark as New
- Bookmark
- Subscribe
- Mute
- Subscribe to RSS Feed
- Permalink
- Report Inappropriate Content
Make an Excel-file for showing budget in a bar chart
Hi,
We have a bar chart with the hours worked(Y-axis) per customers (X-axis) per week.
The dimensions are “week” and “customer”. The expression is the sum of the duration of work.
The data comes with an ODBC-connection from a SQL-database.
Now I want to create an Excel-file with the budget hours per customer.
I managed to join an Excel-file by the column “week”. But for the expression I only can select one customer. When I choose to show a combination graph, it shows 2 line: one for the hours worked and one for the budget hours.
What I would like to see is a line with budget hours in the bar chart for each customer. I want to be able to select a customer and see the budget hours.
How do I format the Excel-file and make it visible per week/customer in Qlikview in an easy way?
- Tags:
- qlikview_scripting
- Mark as New
- Bookmark
- Subscribe
- Mute
- Subscribe to RSS Feed
- Permalink
- Report Inappropriate Content
Hi Dennis,
Sorry to say but your question is a bit confusing.
First you are saying the data is coming from a SQL database, second you are saying you wanted to prepare an excel file and then you are saying you wanted to format Excel to get correct output in QlikView????
Please could you clearly explain what you wanted to achieve?
Regards,
RK
- Mark as New
- Bookmark
- Subscribe
- Mute
- Subscribe to RSS Feed
- Permalink
- Report Inappropriate Content
please post sample data
regards
Marco
- Mark as New
- Bookmark
- Subscribe
- Mute
- Subscribe to RSS Feed
- Permalink
- Report Inappropriate Content
In your load script you could write this:
// Simulates your Customer data from a database:
CustomerData:
LOAD
Chr( Ord('A') + IterNo() -1 ) AS Customer,
RecNo() AS Week,
Ceil( Rand() * 200) + 50 AS HoursWorked
AUTOGENERATE
32
WHILE
IterNo() <= 3
;
JOIN
LOAD Week,
Customer,
Budget
FROM
CustomerHourBudget.XLSX
(ooxml, embedded labels, table is Sheet1);
Your customer budget data could be formatted like this in your Excel-file:

- Mark as New
- Bookmark
- Subscribe
- Mute
- Subscribe to RSS Feed
- Permalink
- Report Inappropriate Content
Thnx Petter. Unfortunately I can't open the qvw-file, because I still use a personal version of Qlikview.
I'm going to test with your information. Is it also possible to make the Excel-file with a column for each costumer? Thats easear to fill every week.
- Mark as New
- Bookmark
- Subscribe
- Mute
- Subscribe to RSS Feed
- Permalink
- Report Inappropriate Content
I'm sorry. To clarify myself:
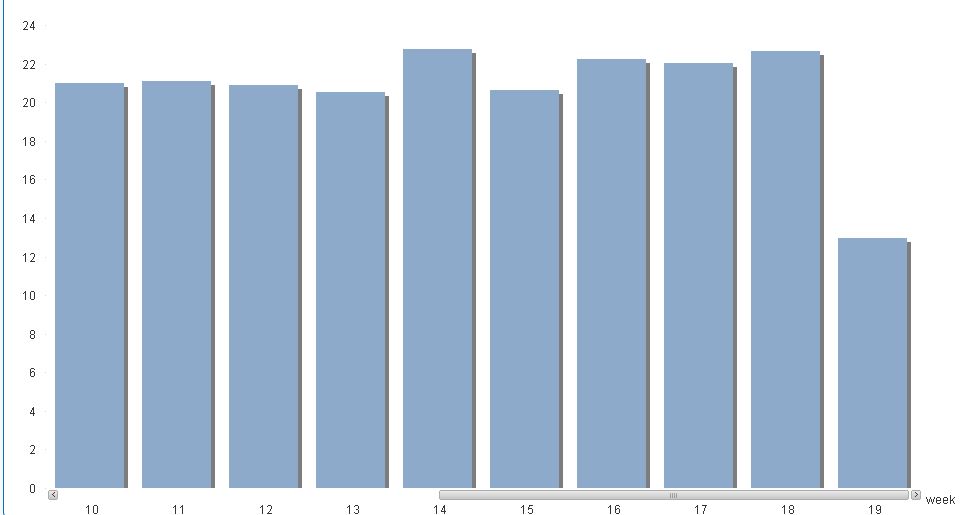
We have the bar chart with the duration in hours of work for the customers for each week. In a List box we have the diffrent customers. When we select a customer from the listbox we see the hours in a bar chart (see picture).
We want to make a Excel-file (like the Excel-file from Petter, see reply from Petter below) with the budget hours for each customer. We want to see the budget hours show in the bar chart (see picture). Sow when we select another customer in the list box, we want to see the budget hours for that customer.
- Mark as New
- Bookmark
- Subscribe
- Mute
- Subscribe to RSS Feed
- Permalink
- Report Inappropriate Content
Yes - with a necessary adjustment in the Load Script it will be possible to organize the Excel-file with columns for each customer.
Like this:
Week# CustA CustB CustC CustD
1 45 120 100 250
2 47 105 110 240
....
And then you will have to use a CrossTable Load:
CROSSTABLE(Customer,Budget)
LOAD
[Week#],
[CustA],
[CustB],
[CustC],
[CustD]
FROM [CustomerBudget.XLSX] (.....);