Unlock a world of possibilities! Login now and discover the exclusive benefits awaiting you.
- Qlik Community
- :
- All Forums
- :
- QlikView App Dev
- :
- Re: How to only show DOT without LINE in Line plot...
- Subscribe to RSS Feed
- Mark Topic as New
- Mark Topic as Read
- Float this Topic for Current User
- Bookmark
- Subscribe
- Mute
- Printer Friendly Page
- Mark as New
- Bookmark
- Subscribe
- Mute
- Subscribe to RSS Feed
- Permalink
- Report Inappropriate Content
How to only show DOT without LINE in Line plot?
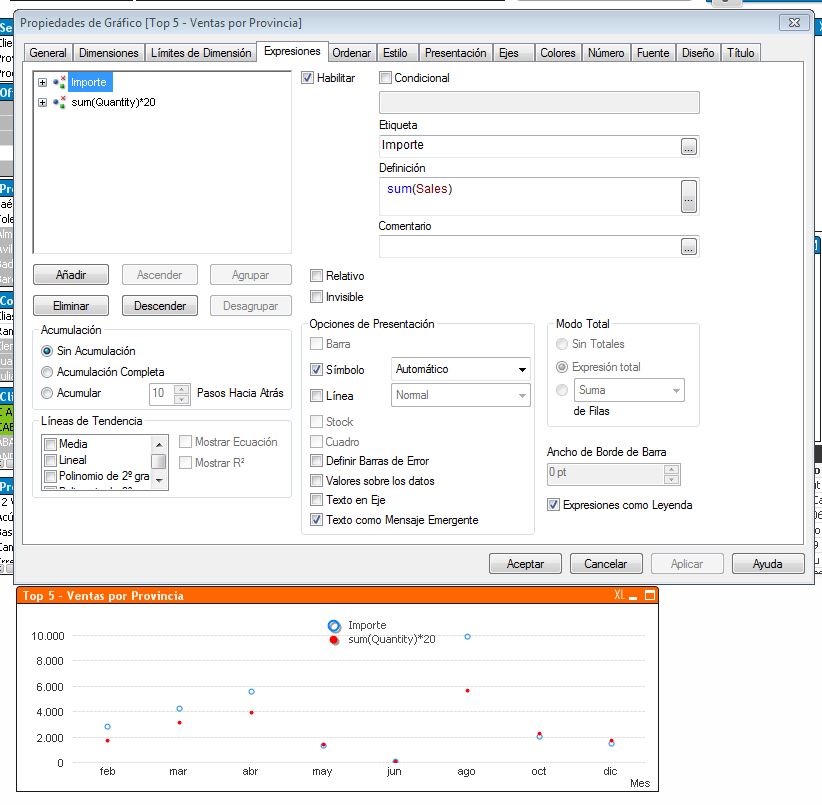
I am creating a a line plot. In the display options for item, I deselect line and select Symbol. I wish the chart will only show data point in symbol without line between data points. However, the line still showup. Only when a part of X-axis selected, the line disappear and only dot showup. Please see the attached two plots. The 2nd plot in the file is what I expect. Thank for any clue in advance!
Xianqun
- Mark as New
- Bookmark
- Subscribe
- Mute
- Subscribe to RSS Feed
- Permalink
- Report Inappropriate Content
Hi, you have to select a line chart
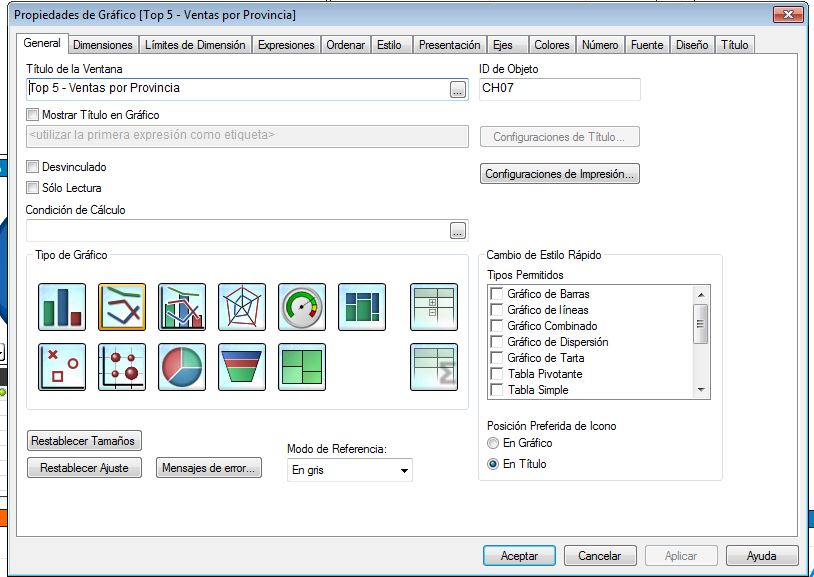
and then select these options
- Mark as New
- Bookmark
- Subscribe
- Mute
- Subscribe to RSS Feed
- Permalink
- Report Inappropriate Content
Pablo, thank for your response. I did exactly same as what your showed in your example, bu the line still showup. Not sure why. Xianqun
- Mark as New
- Bookmark
- Subscribe
- Mute
- Subscribe to RSS Feed
- Permalink
- Report Inappropriate Content
Hi, upload de .qvw to see the problem