Unlock a world of possibilities! Login now and discover the exclusive benefits awaiting you.
- Qlik Community
- :
- Forums
- :
- Analytics
- :
- New to Qlik Analytics
- :
- Re: How to use fields from another table as dimens...
- Subscribe to RSS Feed
- Mark Topic as New
- Mark Topic as Read
- Float this Topic for Current User
- Bookmark
- Subscribe
- Mute
- Printer Friendly Page
- Mark as New
- Bookmark
- Subscribe
- Mute
- Subscribe to RSS Feed
- Permalink
- Report Inappropriate Content
How to use fields from another table as dimension?
Hi all,
I'm new to Qlik sense and I'm struggling with some concepts.
The following screenshot contains part of my data model:
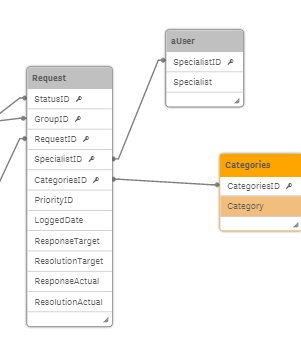
As you can see Request is linked to Categories via CategoriesID
Now I am trying to create a graph displaying the total amount of requests (tickets) per category . For obvious reasons I don't want to use the CategoriesID but the Category field instead.
So far I have the following:
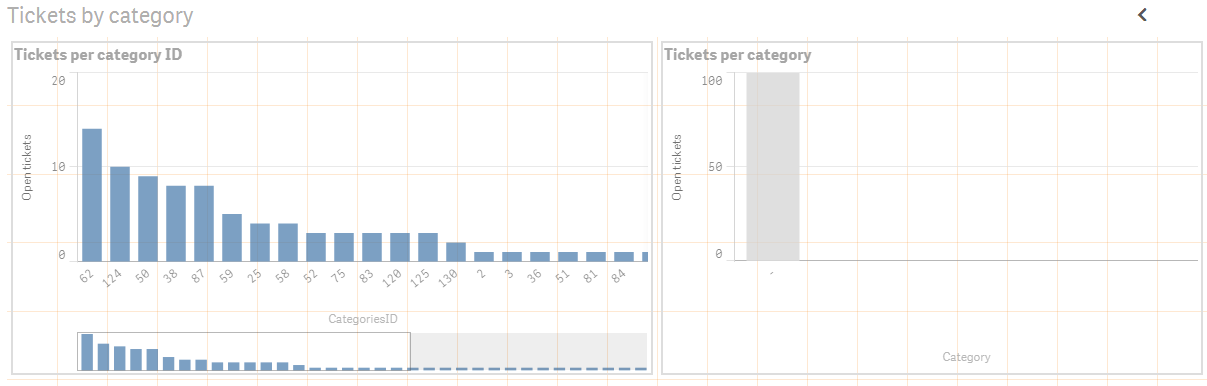
On the left hand side I use CategoriesID as dimension, on the right hand side I use Category as dimension. Both graphs use the same measure.
I would expect that both graphs display the same (except from the labels), however the graph using Category doesn't work at all.
Can someone explain what I'm doing wrong here?
Thanks in advance!
- « Previous Replies
-
- 1
- 2
- Next Replies »
Accepted Solutions
- Mark as New
- Bookmark
- Subscribe
- Mute
- Subscribe to RSS Feed
- Permalink
- Report Inappropriate Content
Hi,
Try this expression
Count({<StatusID-={2}>} DISTINCT RequestID)
Regards,
jagan.
- Mark as New
- Bookmark
- Subscribe
- Mute
- Subscribe to RSS Feed
- Permalink
- Report Inappropriate Content
Your logic is fine, but I think that the Category field has not been populated, or the category IDs from the Request table do not align with the IDs in the Categories table - so the metric from the Request table also does not align.
It could be that one is being loaded as text and the other as a number - they would look the same but would be the same.
Create a table box with Category and CategoryID to examine the contents to diagnose this problem. Allow numbers to align to the right and text to align to the left.
- Mark as New
- Bookmark
- Subscribe
- Mute
- Subscribe to RSS Feed
- Permalink
- Report Inappropriate Content
Hi Jonathan,
Thank you for your response.
I created the following table with CategoriesID and their Category.
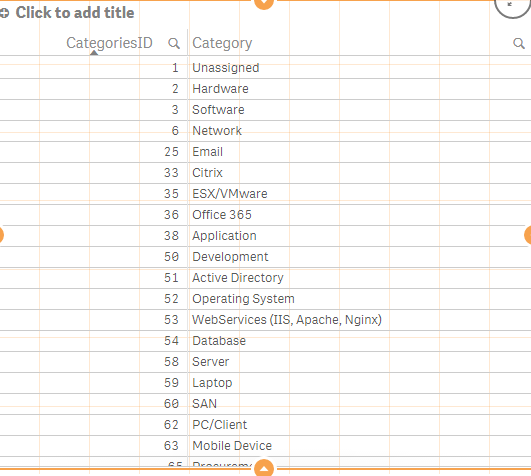
The categories seem to align fine.
I also checked if CategoriesID from Request is linked to CategoriesID in Categories in my data source (SQL server):
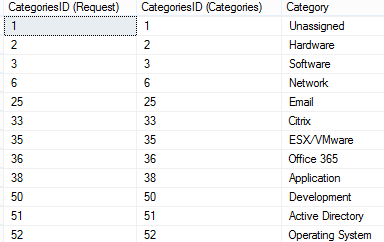
It seems that everything is linked correctly.
- Mark as New
- Bookmark
- Subscribe
- Mute
- Subscribe to RSS Feed
- Permalink
- Report Inappropriate Content
HI Bas, can you upload your qvf
Andy
- Mark as New
- Bookmark
- Subscribe
- Mute
- Subscribe to RSS Feed
- Permalink
- Report Inappropriate Content
Can you add the measure to the table you've created using QlikSense?
- Mark as New
- Bookmark
- Subscribe
- Mute
- Subscribe to RSS Feed
- Permalink
- Report Inappropriate Content
When I do that the table becomes like this:
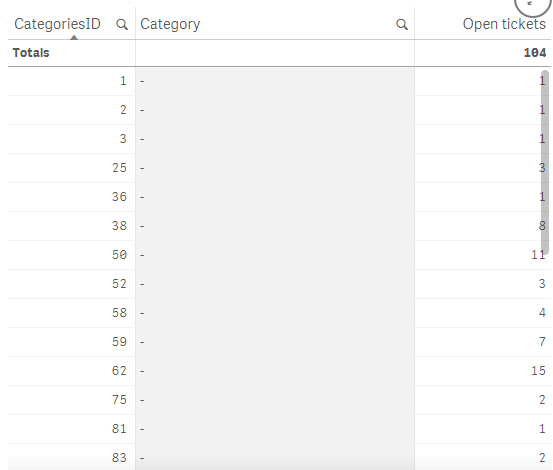
The weird thing is that if I place the same measure in a KPI it displays correct.
This is my measure:
Count(DISTINCT {$-<StatusID={2}>} RequestID)
So everything not closed is counted as open.
When I replace the measure expression as following:
SUM(
If(
StatusID <> 2,
1, 0
)
)
Then the table and graph renders correctly. However this expression returns the incorrect result so I have to use the first one.
- Mark as New
- Bookmark
- Subscribe
- Mute
- Subscribe to RSS Feed
- Permalink
- Report Inappropriate Content
Hi Andrew,
Is there a way to export a qvf without data? Most of the data I've loaded must remain secret.
- Mark as New
- Bookmark
- Subscribe
- Mute
- Subscribe to RSS Feed
- Permalink
- Report Inappropriate Content
You can try to load only sample data.
- Mark as New
- Bookmark
- Subscribe
- Mute
- Subscribe to RSS Feed
- Permalink
- Report Inappropriate Content
Hi,
Maybe CategoryID is a number in a table and a text in the other ?
Have you try to force conversion in the script.
- Mark as New
- Bookmark
- Subscribe
- Mute
- Subscribe to RSS Feed
- Permalink
- Report Inappropriate Content
Hi,
Try this expression
Count({<StatusID-={2}>} DISTINCT RequestID)
Regards,
jagan.
- « Previous Replies
-
- 1
- 2
- Next Replies »